. 2007;35(3):771-88.
doi: 10.1093/nar/gkl956. Epub 2006 Dec 22.

Anatomy of Escherichia coli sigma70 promoters

Affiliations

Anatomy of Escherichia coli sigma70 promoters

Ryan K Shultzaberger et al. Nucleic Acids Res. 2007.

Abstract

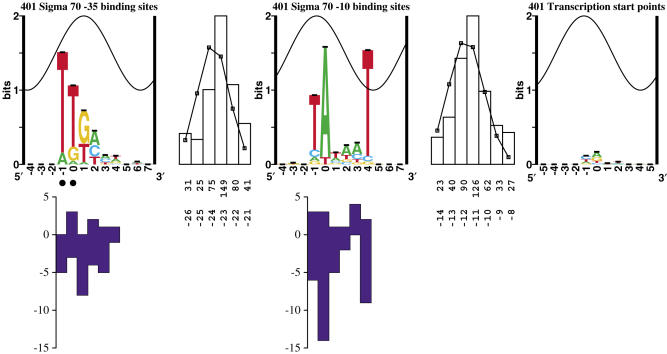
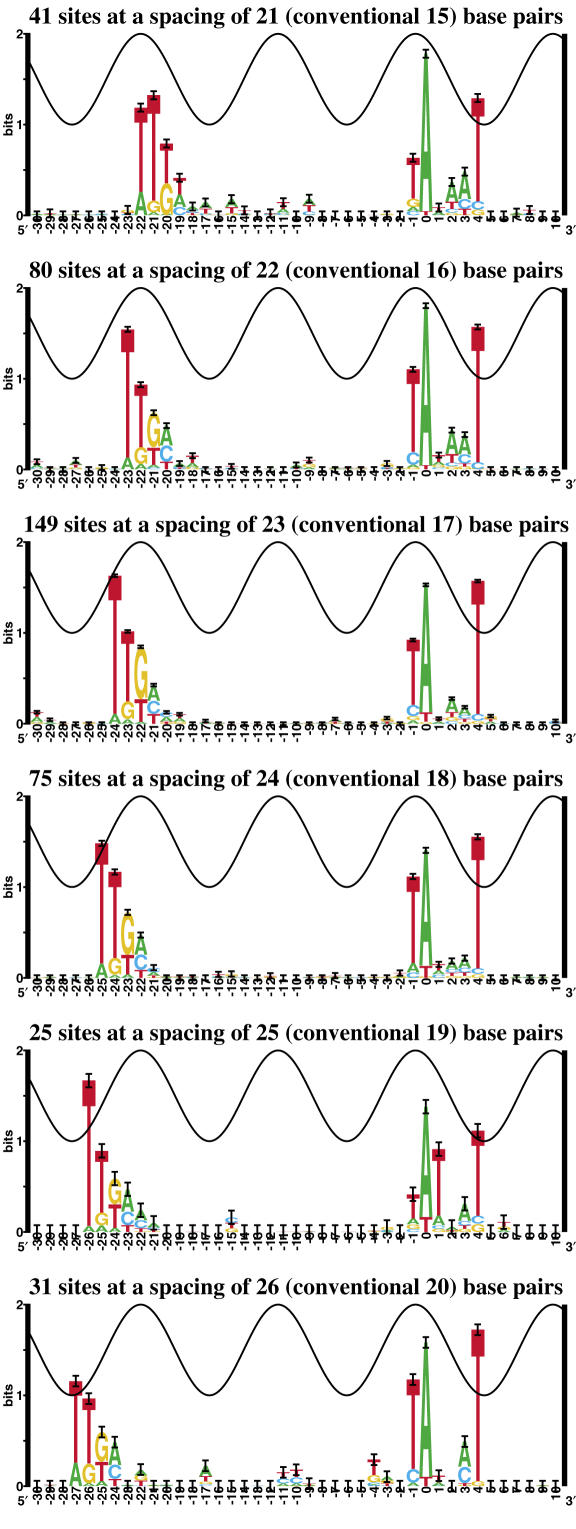
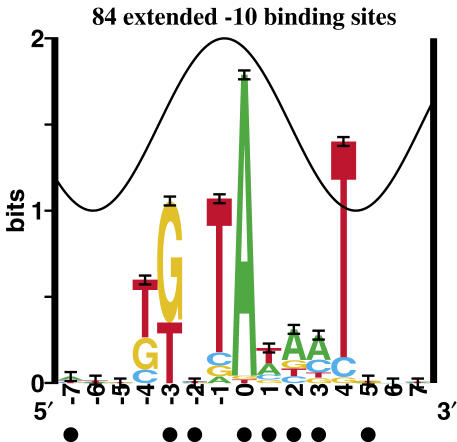
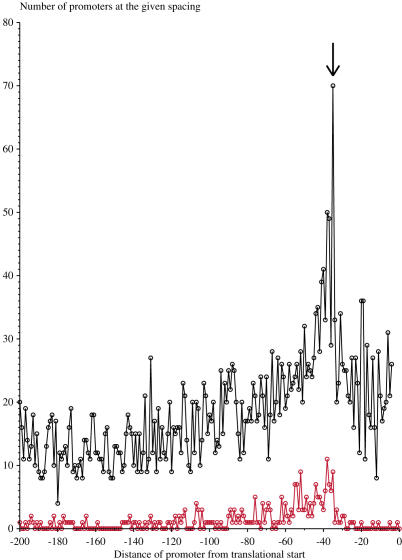
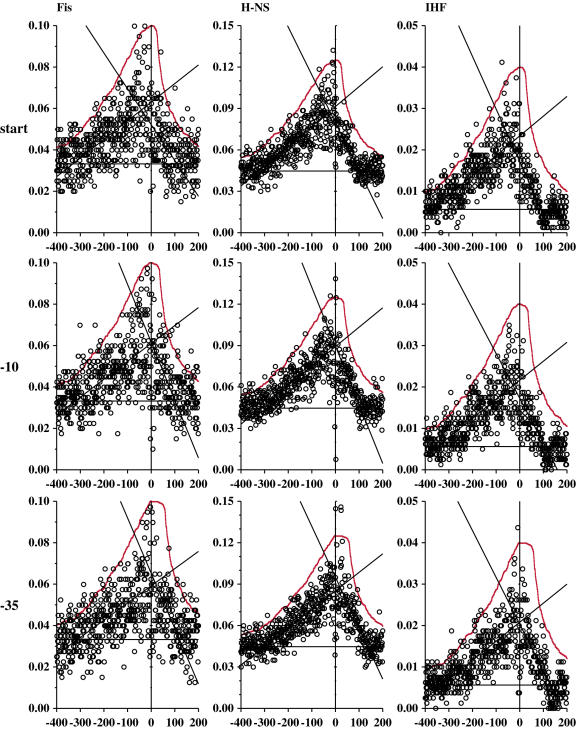
Information theory was used to build a promoter model that accounts for the -10, the -35 and the uncertainty of the gap between them on a common scale. Helical face assignment indicated that base -7, rather than -11, of the -10 may be flipping to initiate transcription. We found that the sequence conservation of sigma70 binding sites is 6.5 +/- 0.1 bits. Some promoters lack a -35 region, but have a 6.7 +/- 0.2 bit extended -10, almost the same information as the bipartite promoter. These results and similarities between the contacts in the extended -10 binding and the -35 suggest that the flexible bipartite sigma factor evolved from a simpler polymerase. Binding predicted by the bipartite model is enriched around 35 bases upstream of the translational start. This distance is the smallest 5' mRNA leader necessary for ribosome binding, suggesting that selective pressure minimizes transcript length. The promoter model was combined with models of the transcription factors Fur and Lrp to locate new promoters, to quantify promoter strengths, and to predict activation and repression. Finally, the DNA-bending proteins Fis, H-NS and IHF frequently have sites within one DNA persistence length from the -35, so bending allows distal activators to reach the polymerase.


Figures

Figure 1
Figure 1
Sequence logos of σ70 binding components. From left to right: sequence logo of −35 binding sites, spacing distribution between −35 and −10 binding sites, sequence logo of −10 binding sites, spacing distribution between −10 binding sites and the transcription start point, sequence logo of transcription start points. In a logo, the height of each letter is proportional to the frequency of that base at each position, and the height of the letter stack is the conservation in bits (49). Error bars are shown at the top of the stacks. The total information in the −35 and −10, less the gap uncertainty between them, is (4.02 ± 0.09) + (4.78 ± 0.11) − (2.32 ± 0.04) = 6.48 ± 0.14 bits. The sine wave on each logo represents the 10.6 base helical twist of B-form DNA for the optimal spacing of 23 bases, with the major groove centered at +1 of the −35 (41,51). Black dots indicate the location of important 5-methyl groups on thymine and hence determine the location where the major groove faces the sigma factor (81), along with co-crystal data (65). The top row of numbers in each gap distribution gives the number of cases and the bottom row is the difference between the zero coordinates. A Gaussian curve was fit to each of the two gap distributions (thin black line). Mutational data presented by Hawley and McClure (10,11) are shown under the logos by blue bars. Bars above the abscissa represent the number of observed mutations at each position that have strengthened a promoter, while bars below the abscissa represent the number of mutations that have weakened a promoter. Promoter locations and the information contents of their parts are given in Supplementary Data.
Figure 2
Figure 2
Sequence logos for σ70 promoters as a function of spacing. The spacings correspond to the −35 to −10 gap distribution in Figure 1. Conventional spacings are given in parentheses.
Figure 3
Figure 3
The extended −10 has two additionally conserved bases. This is a sequence logo of −10 regions that have no −35 based on our model, but show conservation at positions −4 and −3. Purines protected from DMS methylation and bromouracil substituted thymines protected by the polymerase are indicated by closed circles (109,110).
Figure 4
Figure 4
The optimal spacing of the −10 to the translational initiation codon is ∼35 bases. We plotted the distance between the zero coordinate of the −10 and the translational start point on the abscissa, and the number of promoters at that distance on the ordinate. The upper curve (black) represents data from a scan using our promoter model over the upstream regions of all 4122 genes in E. coli (56). The lower curve (red) represents the location of the −10 relative to translational initiation codons for experimentally verified transcription start points. The arrow pointing to the black curve indicates a peak at −35 bases.
Figure 5
Figure 5
Fur represses transcriptional initiation of tonB. We present here an individual information analysis (46) of the Fur controlled tonB region (71,111) using the sequence walker method (48). Colored rectangles (‘petals’) behind the walkers identify the kind of site (by hue) and the strength of the site (by saturation) (112), (). The connecting bar between parts of a flexible site transitions linearly between the corresponding colors. The σ70 binding site and the ribosome binding site were both located using flexible binding models (34), in that there are variable distances between binding components. The horizontal dashed line underneath the −10 walker (p10) and the −35 walker (p35) that is labeled ‘Gap’, gives the gap surprisal for whatever distance separates the two components, as well as the coordinate of the downstream component. The dashed line that is labeled ‘total’ gives the total information for the flexible site. Similar lines are underneath the ribosome binding site components (SD, IR). A Fur dimethyl sulfate protection footprint is marked (71,111), and two sequence walkers for Fur fall below it. The downstream side of the Fur protected sequence is somewhere in the region marked by asterisks. The sequence that the polymerase and Fur would both bind is marked with a red box. The transcription start point for tonB is marked with a black arrow, and the translational initiation start point is marked at position 1309113 with a bracket and an arrow. The sequences and coordinates on the map are from GenBank accession number U00096 (113).
Figure 6
Figure 6
Transcriptional control by Lrp is based on its spacing relative to the polymerase. (a) An individual information analysis of the Lrp repressed dad operon (–75). (b) An individual information analysis of the Lrp activated gltBDF operon (76). As in Figure 5, the σ70 and ribosome binding sites are each internally connected by lines that report the gap surprisal and total information. Experimentally verified transcription start points are identified with black arrows and named according to Zhi et al. (75), and the dadA gene start is marked with a bracket and arrow at position 1236794. In (b), since Lrp helps to stabilize the initiation complex, its information is added into the total strength of the promoter. Since data on the distance between Lrp sites and the −35 are not available, we did not subtract a gap surprisal and therefore the gap surprisal is marked as NA (not applicable). The sequence and coordinates on the map are from GenBank accession number U00096 (113).
Figure 7
Figure 7
Sequence walkers for σ70 and Fur protein upstream of the (a) yoeA and (b) fhuA genes suggests that these genes are controlled by Fur. Synthetic oligonucleotides that contain sequences marked by brackets under the DNA showed gel mobility shifts by Fur protein (data not shown). The sequence and coordinates on the map are from GenBank accession number U00096 (113).
Figure 8
Figure 8
Intergenic binding of DNA bending proteins relative to promoter components. These curves allow one to directly compare the density of non-coding regions to the number of DNA-binding protein sites at each position relative to experimentally determined promoter components. For all graphs, the abscissa is the position of the regulator binding site (either Fis, H-NS or IHF) relative to either the transcription start, the −10, or the −35 in our promoter model. A vertical line marks the zero coordinate of the promoter component. The ordinate is the frequency of sites at that spacing (sites per base). A solid horizontal line marks the frequency of sites per base predicted for the entire genome. Linear regression lines for −400 to 0 and 0 to 200 are shown. A distribution corresponding to the density of intergenic regions surrounding the experimentally verified promoters was fit to the data in each graph, and is shown as a solid red curve (see Materials and Methods).

References

    1. Horwitz M.S., Loeb L.A. Structure–function relationships in Escherichia coli promoter DNA. Prog. Nucleic Acid Res. Mol. Biol. 1990;38:137–164. - PubMed
    1. Gralla J.D. Promoter recognition and mRNA initiation by Escherichia coli E σ70. Methods Enzymol. 1990;185:37–54. - PubMed
    1. deHaseth P.L., Zupancic M.L., Record M.T., Jr RNA polymerase–promoter interactions: the comings and goings of RNA polymerase. J. Bacteriol. 1998;180:3019–3025. - PMC - PubMed
    1. Browning D.F., Busby S.J. The regulation of bacterial transcription initiation. Nat. Rev. Microbiol. 2004;2:57–65. - PubMed
    1. Burgess R.R., Travers A.A., Dunn J.J., Bautz E.K. Factor stimulating transcription by RNA polymerase. Nature. 1969;221:43–46. - PubMed

Publication types