. 2007 Mar;189(5):1866-73.
doi: 10.1128/JB.01658-06. Epub 2006 Dec 22.

Role of mRNA stability in growth phase regulation of gene expression in the group A streptococcus

Affiliations

Role of mRNA stability in growth phase regulation of gene expression in the group A streptococcus

Timothy C Barnett et al. J Bacteriol. 2007 Mar.

Abstract

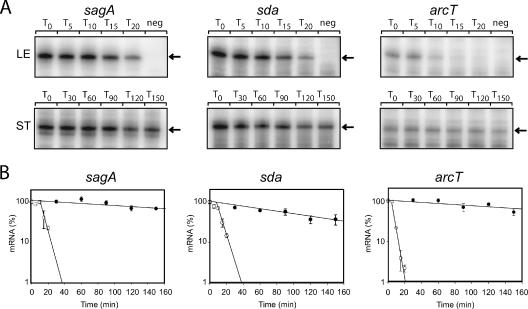
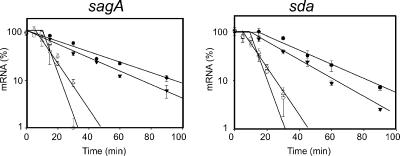
The impressive disease spectrum of Streptococcus pyogenes (the group A streptococcus [GAS]) is believed to be determined by its ability to modify gene expression in response to environmental stimuli. Virulence gene expression is controlled tightly by several different transcriptional regulators in this organism. In addition, expression of most, if not all, GAS genes is determined by a global mechanism dependent on growth phase. To begin an analysis of growth-phase regulation, we compared the transcriptome 2 h into stationary phase to that in late exponential phase of a serotype M3 GAS strain. We identified the arc transcript as more abundant in stationary phase in addition to the sag and sda transcripts that had been previously identified. We found that in stationary phase, the stability of sagA, sda, and arcT transcripts increased dramatically. We found that polynucleotide phosphorylase (PNPase [encoded by pnpA]) is rate limiting for decay of sagA and sda transcripts in late exponential phase, since the stability of these mRNAs was greater in a pnpA mutant, while stability of control mRNAs was unaffected by this mutation. Complementation restored the wild-type decay rate. Furthermore, in a pnpA mutant, the sagA mRNA appeared to be full length, as determined by Northern hybridization. It seems likely that mRNAs abundant in stationary phase are insensitive to the normal decay enzyme(s) and instead require PNPase for this process. It is possible that PNPase activity is limited in stationary phase, allowing persistence of these important virulence factor transcripts at this phase of growth.


Figures

FIG. 1.
FIG. 1.
Decay rate of sagA, sda, and arcT transcripts in late exponential (LE) and stationary (ST) phases determined by RPAs. (A) RNA was extracted from MGAS315 at the times (minutes) indicated above each lane following the addition of rifampin to halt transcription. RPAs were performed as described previously (11) using 10 μg total RNA from exponential phase and 5 μg from stationary phase. A negative control for each probe (neg) consists of labeled probe without RNA. The arrow to the right of each gel indicates the expected size of the protected RNA probe following digestion with RNase T1. (B) The amount of each transcript in Fig. 1A was quantified using ImageQuant 5.0 software (Molecular Dynamics). The average intensity of each band was calculated for each time point. The y axes of the graphs represent the fraction (%) of each message remaining at the indicated time after addition of rifampin. Error bars represent the standard deviation of values obtained for each time point from two independent reactions. Regression analysis was performed using SigmaPlot 9.0 software (SPSS Inc.) and used to calculate the slope of each line. Open symbols, late exponential phase; closed symbols, stationary phase.
FIG. 2.
FIG. 2.
Decay of the hasABC transcript expressed from the Psag promoter in stationary-phase cells. (A) Diagram showing pJRS1293. The fusion consists of the entire hasABC transcript (postitions +1 to 3837; gray) fused to the Psag promoter region (black). The lollipop symbols represent predicted Rho-independent transcriptional terminators. RNase protection assays (B) and the decay curve calculations (C) were performed as described for Fig. 1.
FIG. 3.
FIG. 3.
Northern blot analysis of sagA mRNA decay in late exponential (LE) and stationary (ST) phases. (A) Diagram showing the region complementary to the RNA probe used to detect sagA messages. (B) RNA was extracted from MGAS315 at the times (minutes) indicated above each lane following the addition of rifampin to halt transcription. The size of RNA markers (in nucleotides) run on the same gel is indicated to the left. The expected size of the full-length sagA transcript is indicated with an arrow to the right.
FIG. 4.
FIG. 4.
Exponential-phase decay of sagA and sda transcripts in MGAS315 (wild type), JRS1392 (pnpA), and complemented strains. Ten micrograms of total RNA was used for each RPA, and regression analyses were performed as described for Fig. 1. ○, MGAS315 (wild type); •, JRS1392 (ΔpnpA); ▾, JRS1392/pJRS1289 (vector control); ▿, JRS1392/pJRS1293 (pnpA complementation).
FIG. 5.
FIG. 5.
Stationary-phase expression of sagA mRNA from different promoters. (A) Diagram of the Phas-sagA and Psag-sagA constructs. The Phas-sagA fusion consists of the entire sagA transcript (+1 to +602; thick black line) fused to the Phas promoter (gray line) by overlap-extension PCR. The loop downstream of sagA represents a transcriptional pause site at which most of the mRNA produced from Psag is terminated in vivo. (B) RPAs were performed on 100 ng RNA. The arrow to the right indicates the expected size of the protected RNA probe.

References

    1. Baga, M., M. Goransson, S. Normark, and B. E. Uhlin. 1988. Processed mRNA with differential stability in the regulation of E. coli pilin gene expression. Cell 52:197-206. - PubMed
    1. Barnett, T. C., A. R. Patel, and J. R. Scott. 2004. A novel sortase, SrtC2, from Streptococcus pyogenes anchors a surface protein containing a QVPTGV motif to the cell wall. J. Bacteriol. 186:5865-5875. - PMC - PubMed
    1. Beres, S. B., G. L. Sylva, K. D. Barbian, B. Lei, J. S. Hoff, N. D. Mammarella, M. Y. Liu, J. C. Smoot, S. F. Porcella, L. D. Parkins, D. S. Campbell, T. M. Smith, J. K. McCormick, D. Y. Leung, P. M. Schlievert, and J. M. Musser. 2002. Genome sequence of a serotype M3 strain of group A Streptococcus: phage-encoded toxins, the high-virulence phenotype, and clone emergence. Proc. Natl. Acad. Sci. USA 99:10078-10083. - PMC - PubMed
    1. Bernstein, J. A., A. B. Khodursky, P. H. Lin, S. Lin-Chao, and S. N. Cohen. 2002. Global analysis of mRNA decay and abundance in Escherichia coli at single-gene resolution using two-color fluorescent DNA microarrays. Proc. Natl. Acad. Sci. USA 99:9697-702. - PMC - PubMed
    1. Caparon, M. G., R. T. Geist, J. Perez-Casal, and J. R. Scott. 1992. Environmental regulation of virulence in group A streptococci: transcription of the gene encoding M protein is stimulated by carbon dioxide. J. Bacteriol. 174:5693-5701. - PMC - PubMed

Publication types

MeSH terms

Substances