. 2007 Feb;17(2):240-8.
doi: 10.1101/gr.5681207. Epub 2006 Dec 22.

Rapid and cost-effective polymorphism identification and genotyping using restriction site associated DNA (RAD) markers

Affiliations

Rapid and cost-effective polymorphism identification and genotyping using restriction site associated DNA (RAD) markers

Michael R Miller et al. Genome Res. 2007 Feb.

Abstract

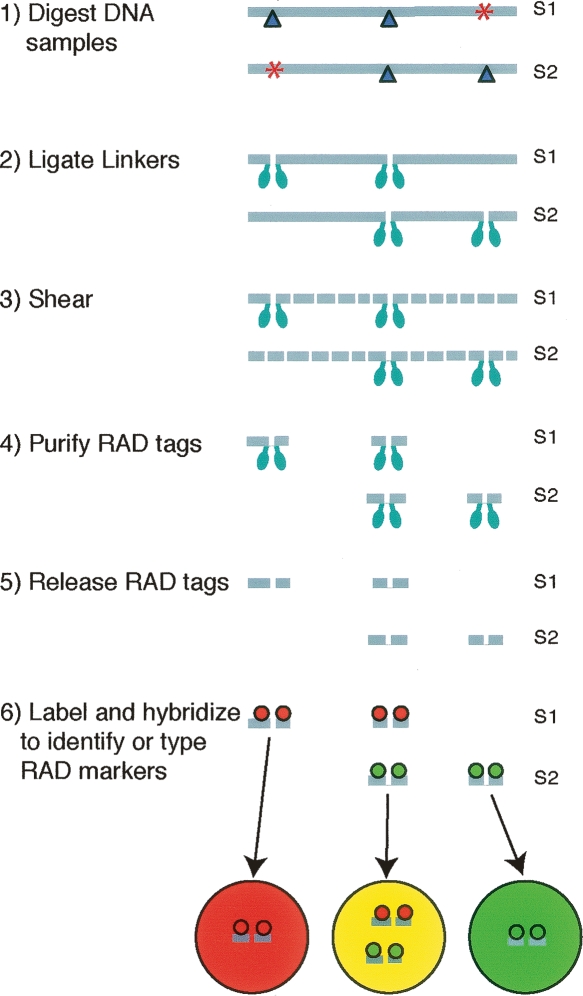
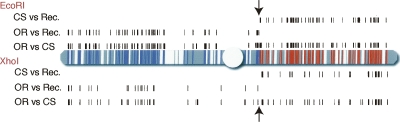
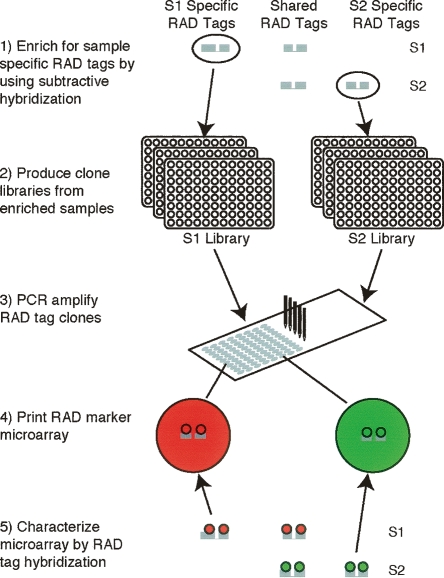
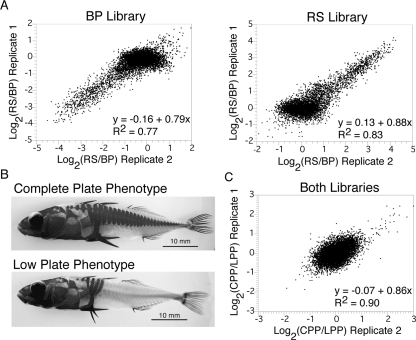
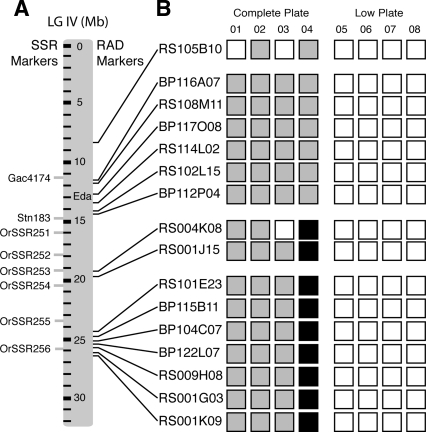
Restriction site associated DNA (RAD) tags are a genome-wide representation of every site of a particular restriction enzyme by short DNA tags. Most organisms segregate large numbers of DNA sequence polymorphisms that disrupt restriction sites, which allows RAD tags to serve as genetic markers spread at a high density throughout the genome. Here, we demonstrate the applicability of RAD markers for both individual and bulk-segregant genotyping. First, we show that these markers can be identified and typed on pre-existing microarray formats. Second, we present a method that uses RAD marker DNA to rapidly produce a low-cost microarray genotyping resource that can be used to efficiently identify and type thousands of RAD markers. We demonstrate the utility of the former approach by using a tiling path array for the fruit fly to map a recombination breakpoint, and the latter approach by creating and using an enriched RAD marker array for the threespine stickleback. The high number of RAD markers enabled localization of a previously identified region, as well as a second region also associated with the lateral plate phenotype. Taken together, our results demonstrate that RAD markers, and the method to develop a RAD marker microarray resource, allow high-throughput, high-resolution genotyping in both model and nonmodel systems.


Figures

Figure 1.
Figure 1.
Restriction site associated DNA (RAD) markers can be identified and typed by detecting differential hybridization patterns of RAD tags on a microarray. Genomic DNA samples S1 and S2 contain the recognition sequence for various restriction enzymes at locations throughout the genome. Dark blue triangles represent restriction sites of a particular enzyme. Some of these restriction sites are only present in one sample because of polymorphisms that disrupt the recognition sequence (red asterisks). The two samples are separately digested with a particular restriction enzyme and then ligated to biotinylated linkers (light blue ellipses). The DNA is randomly sheared leaving only the fragments that were directly flanking a restriction site attached to biotin linkers. These fragments are purified using streptavidin beads and released by digestion at the original restriction site. Loci containing polymorphisms, such as the left locus of S2 or the right locus of S1, will not contain tags for that locus in the purified RAD-tag sample, thus resulting in differential hybridization patterns of RAD tags on a microarray.
Figure 2.
Figure 2.
Recombination breakpoint mapping using RAD markers in Drosophila. Polymorphic RAD markers between Oregon-R (OR) and Canton-S (CS) flies were identified on a genomic tiling path microarray. Black tick marks above the diagrammed second chromosome represent the genomic locations of EcoRI RAD tags with an average differential hybridization greater than twofold. Tick marks below the chromosome represent XhoI RAD tags with a differential hybridization >2.3-fold. Polymorphic markers are found when the recombinant line (Rec.) is compared to the OR parental line on the left arm of the chromosome and when compared to the CS parental line on most of the right arm of the chromosome. Marker patterns indicative of CS inheritance are shown as blue regions of the chromosome, and OR inheritance as red. Arrows mark the recombination breakpoint. Large gaps in the tiling array are shown as white regions of the chromosome.
Figure 3.
Figure 3.
Enriched RAD marker microarray production and characterization. RAD-tag samples S1 and S2 contain polymorphic sets of RAD tags. RAD tags that are present in both individuals will not serve as informative markers. In order to produce an array that types a large number of informative markers, subtractive hybridization is used to enrich for sample-specific RAD tags. RAD-tag clone libraries are generated from these enriched samples. These clone libraries are used as templates for PCR, the products of which are spotted to produce RAD marker microarrays. To identify informative markers, RAD-tag samples S1 and S2 are fluorescently labeled and competitively hybridized directly against each other to the array.
Figure 4.
Figure 4.
RAD marker microarray characterization and bulk mapping experiments. (A) RAD tags from BP (Bear Paw individual) and RS (Rabbit Slough individual) were fluorescently labeled and competitively hybridized directly against each other to the RAD marker microarray. Scatterplots are of two experimental replicates. Array elements from the BP library are shown on the left, RS library elements on the right. Elements having high ratios are specifically from the RS library; elements having low ratios are from the BP library. The least-squares, best-fit regression equations (bottom right of each plot) were calculated for elements with an average hybridization difference greater than twofold. (B) The complete and low lateral plate phenotypes. Lateral plate reduction behaves as a recessive Mendelian locus. (C) Bulk-segregant analysis of the lateral plate phenotype. RAD tags isolated from a complete plate pool (CPP) and a low plate pool (LPP) were fluorescently labeled and competitively hybridized directly against each other to the RAD array. Elements from both libraries are shown together. Notice the larger hybridization differences seen from RAD markers that are linked to the complete plate allele than to the low plate allele. This is expected because of the recessive nature of the low plate phenotype.
Figure 5.
Figure 5.
Bulk segregant analysis of RAD markers identifies two regions associated with the lateral plate phenotype. Sixteen RAD markers (small black bars) with large hybridization differences in the bulk experiments of the complete plate pool versus low plate pool were sequenced and placed on linkage group IV. (A) Six markers clustered in a 3-Mb region surrounding Eda, the previously identified lateral plate locus. Seven markers also cluster in a 2-Mb region near position 25 Mb, suggesting that this region is also associated with the lateral plate phenotype. A microsatellite marker near the center of this cluster, OrSSR256, confirmed this result. (B) Individual RAD marker data confirm the bulk mapping results. The RAD-tag sample from each of eight F2 individuals was run directly against the tags from BP (Bear Paw individual) in one hybridization experiment and RS (Rabbit Slough individual) in a separate experiment. These RAD-tag hybridization patterns can be used to determine individual genotypes (open box, homozygous BP; gray box, heterozygous; black box, homozygous RS) (see Supplemental Fig. 1 for raw data). Columns represent individuals; rows represent markers. One of the four complete plate individuals (04) is heterozygous at the RAD markers around Eda (presence of both complete plate and low plate tags), but is homozygous for the complete plate allele at the 25-Mb cluster and the two markers at 19 Mb, suggesting a recombination event between the Eda cluster and the markers at 19 Mb. Individual 03 lacked the complete plate allele at RS004K08 but had a complete plate allele at RS001J15 and the cluster around Eda, suggesting both a recombination event between RS001J15 and RS004K08 and another recombination event in the region between RS004K08 and the cluster around Eda. Microsatellite markers confirmed the recombination event between RS001J15 and RS004K08 and further localized the second recombination event between OrSSR252 and OrSSR251.

References

    1. Bell M.A., Foster S.A., Foster S.A. The evolutionary biology of the threespine stickleback. Oxford University Press; Oxford, New York: 1994.
    1. Birney E., Andrews D., Caccamo M., Chen Y., Clarke L., Coates G., Cox T., Cunningham F., Curwen V., Cutts T., Andrews D., Caccamo M., Chen Y., Clarke L., Coates G., Cox T., Cunningham F., Curwen V., Cutts T., Caccamo M., Chen Y., Clarke L., Coates G., Cox T., Cunningham F., Curwen V., Cutts T., Chen Y., Clarke L., Coates G., Cox T., Cunningham F., Curwen V., Cutts T., Clarke L., Coates G., Cox T., Cunningham F., Curwen V., Cutts T., Coates G., Cox T., Cunningham F., Curwen V., Cutts T., Cox T., Cunningham F., Curwen V., Cutts T., Cunningham F., Curwen V., Cutts T., Curwen V., Cutts T., Cutts T., et al. Ensembl 2006. Nucleic Acids Res. 2006;34:D556–D561. - PMC - PubMed
    1. Borevitz J.O., Liang D., Plouffe D., Chang H.S., Zhu T., Weigel D., Berry C.C., Winzeler E., Chory J., Liang D., Plouffe D., Chang H.S., Zhu T., Weigel D., Berry C.C., Winzeler E., Chory J., Plouffe D., Chang H.S., Zhu T., Weigel D., Berry C.C., Winzeler E., Chory J., Chang H.S., Zhu T., Weigel D., Berry C.C., Winzeler E., Chory J., Zhu T., Weigel D., Berry C.C., Winzeler E., Chory J., Weigel D., Berry C.C., Winzeler E., Chory J., Berry C.C., Winzeler E., Chory J., Winzeler E., Chory J., Chory J. Large-scale identification of single-feature polymorphisms in complex genomes. Genome Res. 2003;13:513–523. - PMC - PubMed
    1. Botstein D., White R.L., Skolnick M., Davis R.W., White R.L., Skolnick M., Davis R.W., Skolnick M., Davis R.W., Davis R.W. Construction of a genetic linkage map in man using restriction fragment length polymorphisms. Am. J. Hum. Genet. 1980;32:314–331. - PMC - PubMed
    1. Breseghello F., Sorrells M.E., Sorrells M.E. Association mapping of kernel size and milling quality in wheat (Triticum aestivum L.) cultivars. Genetics. 2006;172:1165–1177. - PMC - PubMed

Publication types