. 2006 Dec 26;4(1):38.
doi: 10.1186/1741-7015-4-38.

Collagen reorganization at the tumor-stromal interface facilitates local invasion

Affiliations

Collagen reorganization at the tumor-stromal interface facilitates local invasion

Paolo P Provenzano et al. BMC Med. .

Abstract

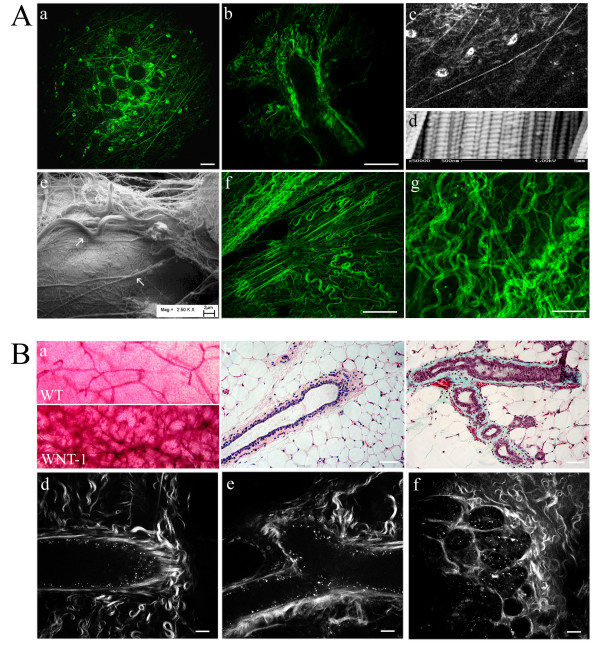
Background: Stromal-epithelial interactions are of particular significance in breast tissue as misregulation of these interactions can promote tumorigenesis and invasion. Moreover, collagen-dense breast tissue increases the risk of breast carcinoma, although the relationship between collagen density and tumorigenesis is not well understood. As little is known about epithelial-stromal interactions in vivo, it is necessary to visualize the stroma surrounding normal epithelium and mammary tumors in intact tissues to better understand how matrix organization, density, and composition affect tumor formation and progression.

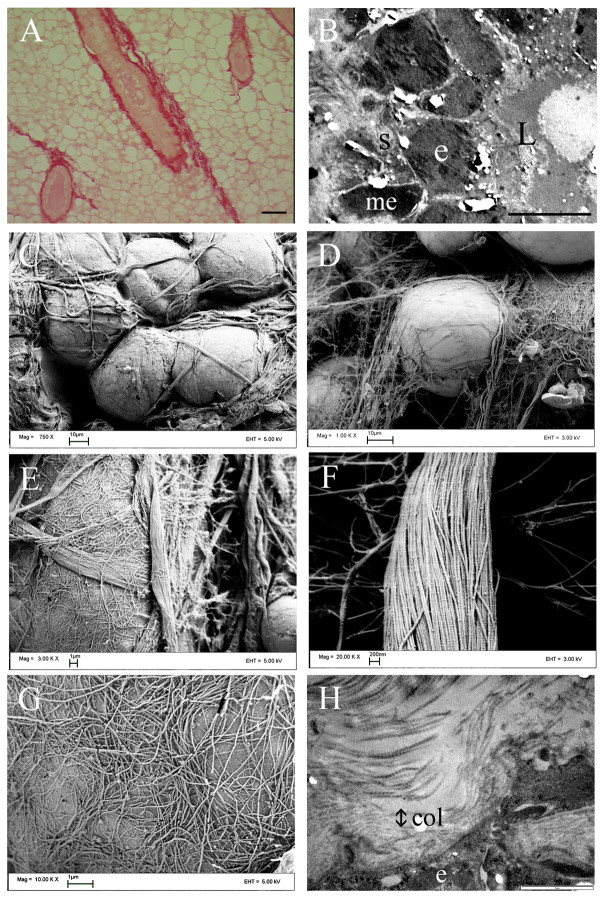
Methods: Epithelial-stromal interactions in normal mammary glands, mammary tumors, and tumor explants in three-dimensional culture were studied with histology, electron microscopy, and nonlinear optical imaging methodologies. Imaging of the tumor-stromal interface in live tumor tissue ex vivo was performed with multiphoton laser-scanning microscopy (MPLSM) to generate multiphoton excitation (MPE) of endogenous fluorophores and second harmonic generation (SHG) to image stromal collagen.

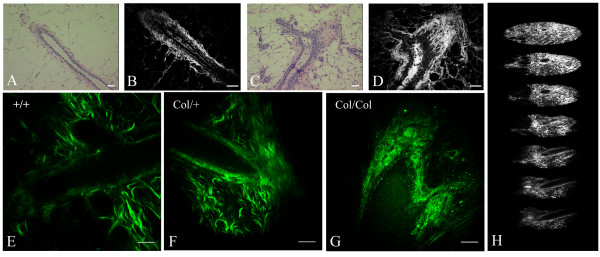
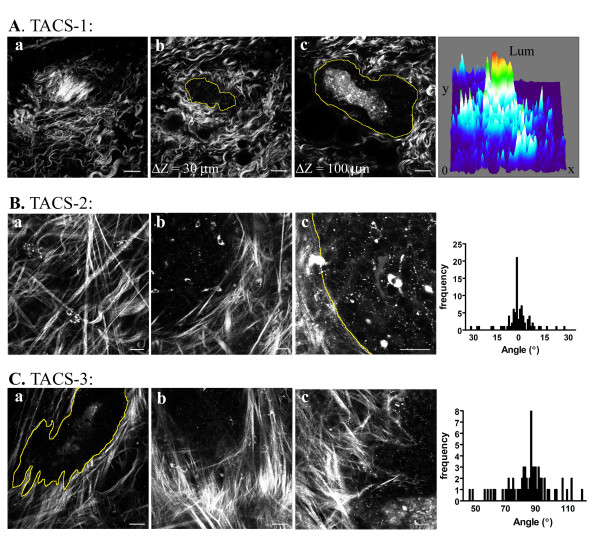
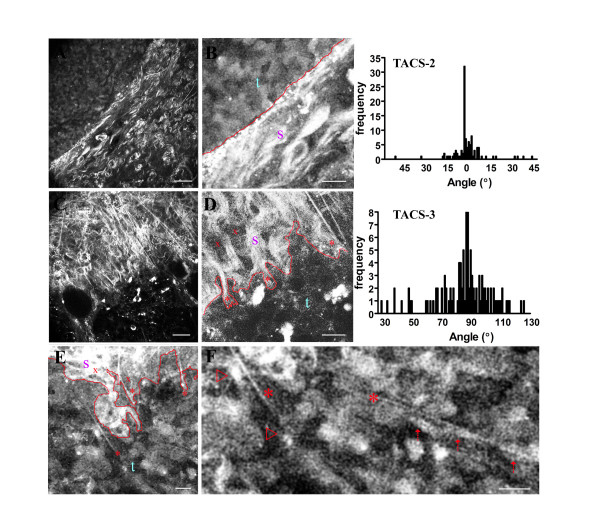
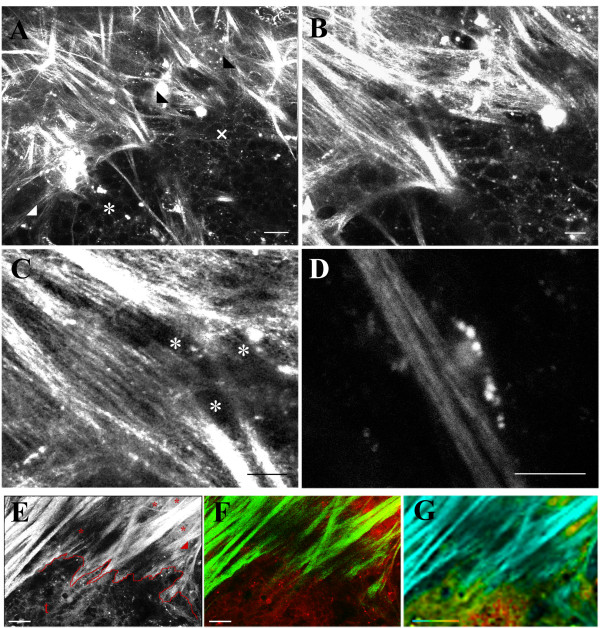
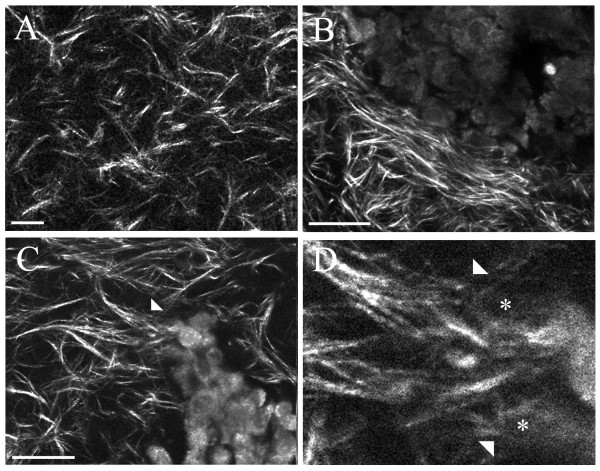
Results: We used both laser-scanning multiphoton and second harmonic generation microscopy to determine the organization of specific collagen structures around ducts and tumors in intact, unfixed and unsectioned mammary glands. Local alterations in collagen density were clearly seen, allowing us to obtain three-dimensional information regarding the organization of the mammary stroma, such as radiating collagen fibers that could not have been obtained using classical histological techniques. Moreover, we observed and defined three tumor-associated collagen signatures (TACS) that provide novel markers to locate and characterize tumors. In particular, local cell invasion was found predominantly to be oriented along certain aligned collagen fibers, suggesting that radial alignment of collagen fibers relative to tumors facilitates invasion. Consistent with this observation, primary tumor explants cultured in a randomly organized collagen matrix realigned the collagen fibers, allowing individual tumor cells to migrate out along radially aligned fibers.

Conclusion: The presentation of these tumor-associated collagen signatures allowed us to identify pre-palpable tumors and see cells at the tumor-stromal boundary invading into the stroma along radially aligned collagen fibers. As such, TACS should provide indications that a tumor is, or could become, invasive, and may serve as part of a strategy to help identify and characterize breast tumors in animal and human tissues.


Figures

Figure 1
Figure 1
Collagen morphology and the epithelial-stromal interaction in the mammary gland. (A) Picrosirius red staining (red), a selective collagen stain, indicating the primary stromal component is collagen (bar = 50 μm). (B) Low magnification (bar = 10 μm) TEM image of a mouse mammary duct (transverse section) showing the organization of epithelial (e) and myoepithelial (me) cells outside the lumen (L) in close association with the collagenous stroma (s), with myoepithelial cells not completely separating the stroma from the epithelial cells. (C) SEM image of the ductal end. (D) SEM image of collagen fibers interacting with ductal epithelial cells. (E) SEM image of collagen bundles wrapping around the cell in multiple directions. (F) Collagen fibrils possessing a rod-like structure with the characteristic ~67 nm banding pattern validating the presence of fibrillar collagen in proximity to epithelial cells. (G) SEM image of collagen fibrils immediately adjacent to the cell surface. (H) TEM image of collagen fibrils (col) next to the epithelial cell (e).
Figure 2
Figure 2
MPLSM/SHG imaging reveals native collagen structure in living mammary gland. A: (a) MPE/SHG image at the "top" of the mammary duct, showing both wavy and taut (straight) collagen structures as well as endogenous fluorescence from FAD in stromal cells (most likely fibroblasts and immune cells). (b) MPE/SHG image of a mammary duct demonstrating collagen wrapped around the duct as well as radiating out from the duct (as can be seen predominantly at the top of the micrograph near the end of the duct). (c) Enlarged section from (a) showing some aspects of collagen fibril structure that resemble the standard banding pattern seen in collagen fibrils from connective tissue. (d) SEM of mouse tendon mouse tendon demonstrating the ~67 nm banding pattern characteristic of collagen fibrils. (e) Correlative SEM image of collagen surrounding ductal epithelial cells showing both wavy (upper arrow) and taut (lower arrow) fibers that match the collagen structures obtained with MPE/SHG imaging. (f) MPE/SHG image of the region near the nipple in tissue demonstrating straightened collagen fibers radiating from the central ductal structure. (g) MPE/SHG image "above" the mammary duct showing both wavy and taut fiber structures. Note: all mammary tissues in A are from the B6/129 strain, which serves as the background strain for col1a1 mice. B: (a) Whole mount analysis from wild type control (top) and Wnt-1 mice (bottom), which display hyperplasia compared to wild type glands. (b,c) Histology of mammary glands from wild type control animals (b; H&E) and hyperplastic abnormal ducts from Wnt-1 mice (c; Masson's Trichrome). (d,e) MPLSM/SHG imaging of wild type control mammary duct demonstrating a ductal end (d) and branching (e). (f) MPLSM/SHG imaging of a mammary duct from a Wnt-1 mouse showing hyperplasia of the ductal structure and increased deposition of disorganized collagen. Note: All MPE/SHG images are from live intact tissues that are not fixed, sectioned, or stained; scale bar for MPE/SHG images equals 25 μm; scale bar for histology images equals 50 μm.
Figure 3
Figure 3
MPLSM/SHG imaging detects increased collagen density in the mammary gland. (A) H&E stain of wild type control mammary gland imaged with bright field microscopy. (B) MPE image of (A) showing the power of MPLSM to visualize collagen structure. (C) H&E stain of mammary gland from a col1a1/col1a1 homozygote mouse. (D) MPE image of (C) showing increased visualization of collagen density and structure and the irregular epithelial-stromal boundary, with epithelial cells invading into the locally increased collagen stroma. (E-G) MPLSM/SHG image of live mammary ducts that are not fixed, sectioned, or stained from wild type (E), heterozygous (F), and homozygous (G) col1a1 mice, showing increased collagen density in transgenic animals. (H) Z-stack of (F) spanning 340 μm (typical depth capability 350–440 μm) illustrating the structure of the glands and their relative location in the gland (see Additional file 4). Note: scale bar for MPE/SHG images equals 25 μm.
Figure 4
Figure 4
The tumor-stromal interaction: representation of the three TACS in Wnt-1 mouse tumors. (A-C) Micrographs illustrating the identified TACS. A: TACS-1. MPE/SHG image of TACS-1. Namely, a region of dense collagen (a, and surface map) "above" a non-palpable tumor (b,c; yellow outline) that is indicative of the presence of a small tumor (also see Additional file 5). The surface map quantifies the intensity of the fluorescent signal relative to x-y location, and clearly demonstrates an increased collagen signal, and is representative of six Wnt-1 tumors and eight PyVT tumors (not shown) B: TACS-2. MPE/SHG image of the second TACS indicated by the presence of straightened (taut) fibers characteristic of a larger Wnt-1 tumor. B: a-c, MPE/SHG images of collagen fibers in Wnt-1 mice stretched around a relatively smooth tumor boundary (outlined with a yellow line in c) as demonstrated by the fact that majority of the fibers are parallel to the tumor boundary. B: histogram, the angle of collagen fibers relative to a line tangential to the tumor boundary was measured for 86 regions in six independent tumors, and graphed as a frequency distribution resulting in a distribution of fibers around 0°. C: TACS-3. The third TACS: aligned collagen fibers at regions of cell invasion in Wnt-1 mice. C: a-c, he irregular tumor boundary associated with local invasion is outlined in yellow (in a) and connected to fibers that are primarily distributed normal to the initial tumor boundary, represented by a frequency distribution around 90° relative to the tumor boundary. C: histogram, the angle of collagen fibers relative to a line tangential to the tumor boundary was measured for 71 regions in six independent tumors, and graphed as a frequency distribution resulting in a distribution of fibers near 90°. Scale bars equal 25 μm.
Figure 5
Figure 5
Study of TACS-2 and -3 in the more aggressive PyVT mouse tumor model. (A) TACS-2, with an enlarged cutout region (B) shown at higher brightness and contrast levels and a rough demarcation of the tumor-stromal boundary (red line; s = stroma; t = tumor) to further indicate the wrapping of the collagen parallel to the tumor boundary (distribution near 0°, see top right TACS-2 histogram of 106 regions from eight independent tumors). (C) TACS-3, with an enlarged cutout region (D) shown at higher brightness and contrast levels and a rough demarcation of the tumor-stromal boundary (red line; s = stroma; t = tumor). Note that although some cells have moved past this boundary (examples = x) into the fibers, the boundary serves as a general representation of irregular invasive region into radially aligned collagen fibers (frequency distribution around 90°, see middle right TACS-3 histogram of 109 regions from eight independent tumors). Furthermore, analysis of TACS-3 regions (E) at higher magnification (F) show endogenous cells associated with fibers at the tumor-stromal boundary and within the tumor. * Indicates examples of fibers interdigitated with the invasive tumor boundary and in contact with the invading tumor cells (red arrows). Scale bar for MPE/SHG images A, C, E, and F equals 25 μm, and 10 μm for B and D.
Figure 6
Figure 6
TACS-3 – radially aligned collagen fibers associated with invasion. Combined MPE/SHG imaging of live intact PyVT mammary tumors indicates that (A) non-invading regions (*) possess taut collagen (TACS-2; white arrowhead) wrapped around the tumor, while regions of invasion (x) are linked to aligned collagen, with cells invading along radially aligned collagen fibers (TACS-3; black arrowheads). Examination of invasion at the tumor-stromal interface at higher magnification (B and C) clearly reveals the collagen alignment at specific regions of invasion (B) with tumor cells (*) in between, and in association with, aligned collagen fibers (C). (D) Example of an individual tumor cell attached to a collagen fiber leading away from the primary tumor. Additionally, tumor cells that have invaded across the tumor-stromal boundary can be visualized by separating the MPE and SHG signals or imaging with FLIM. (E) Combined MPE/SHG image of a TACS-3 region facilitating local invasion. The tumor-stromal boundary is not well preserved at this stage, but is roughly outlined in red. Examples of regions of cells that have invaded past the boundary are marked with an asterisk (t = the primary tumor). The red arrowhead indicates cells near the tumor boundary that are migrating along aligned collagen fibers away from the primary tumor. (F) MPE and SHG signal separation of the image shown in E. MPE signal is represented in red pseudo-color while SHG is shown in green pseudo-color. Note the interdigitation of aligned collagen fibers (green) into the tumor, with individual, or lines of, cells (* in E) migrating away from the tumor on collagen fibers. (G) FLIM micrograph of invading cells at the TACS-3 region shown in E and F. Collagen (blue; no fluorescence lifetime) can be distinguished from cells (green to yellow), confirming the presence of invading cells at the tumor-stromal boundary and cells that have migrated past the boundary in association with collagen. The color bar in G ranges represents the weighted mean ranging from 100 ps (blue) to 1 ns (red). Scale bars equal 25 μm in A, E, F, and G; 10 μm in B, C, and D.
Figure 7
Figure 7
Collagen matrix reorganization by tumor cells facilitates local invasion of tumor cells. Combined MPE/SHG imaging of tumor explants cultured within 3D collagen gels for eight hours demonstrates that tumor cells reorganize a previously random matrix to facilitate invasion. (A) Region of 3D collagen gel remote from the tumor demonstrating the random orientation of collagen present within 3D collagen gels in a region that has not been reorganized by a specific outside force. This random organization is specifically altered by cells from tumor explants as the cells contract and reorganize the collagen matrix. Similar to data in live intact tissues, non-invading regions show collagen pulled in near the explant but wrapped around the tumor boundary (B), while at regions of tumor cell invasion into the collagen gel, collagen has been radially aligned by the tumor cells (white arrow heads C) with cells (*) in direct contact with the collagen matrix (white arrowheads; D). Therefore, at regions of tumor cell invasion, collagen has been reorganized to a radial alignment from a random orientation, indicating a structural realignment of collagen fibers facilitates local invasion. Scale bar equals 25 μm.

References

    1. Barcellos-Hoff MH, Aggeler J, Ram TG, Bissell MJ. Functional differentiation and alveolar morphogenesis of primary mammary cultures on reconstituted basement membrane. Development. 1989;105:223–235. - PMC - PubMed
    1. Keely P, Fong A, Zutter M, Santoro S. Alteration of collagen-dependent adhesion, motility, and morphogenesis by the expression of antisense α2 integrin mRNA in mammary cells. J Cell Science. 1995;108:595–607. - PubMed
    1. Roskelley CD, Srebrow A, Bissell MJ. A hierarchy of ECM-mediated signalling regulates tissue-specific gene expression. Curr Opin Cell Biol. 1995;7:736–747. doi: 10.1016/0955-0674(95)80117-0. - DOI - PMC - PubMed
    1. Keely PJ, Wu JE, Santoro SA. The spatial and temporal expression of the alpha 2 beta 1 integrin and its ligands, collagen I, collagen IV, and laminin, suggest important roles in mouse mammary morphogenesis. Differentiation. 1995;59:1–13. doi: 10.1046/j.1432-0436.1995.5910001.x. - DOI - PubMed
    1. Chen J, Diacovo TG, Grenache DG, Santoro SA, Zutter MM. The alpha(2) integrin subunit-deficient mouse: a multifaceted phenotype including defects of branching morphogenesis and hemostasis. Am J Pathol. 2002;161:337–344. - PMC - PubMed

Publication types

MeSH terms