. 2007 Jan 2;104(1):365-70.
doi: 10.1073/pnas.0609551104. Epub 2006 Dec 26.

Penetrating arterioles are a bottleneck in the perfusion of neocortex

Affiliations

Penetrating arterioles are a bottleneck in the perfusion of neocortex

Nozomi Nishimura et al. Proc Natl Acad Sci U S A. .

Abstract

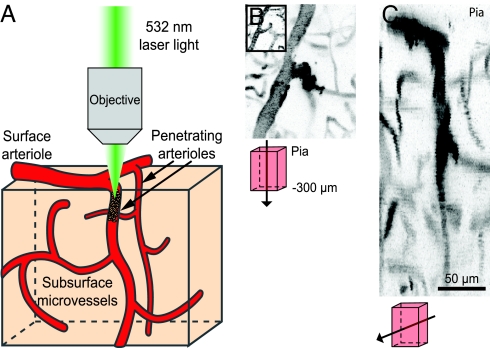
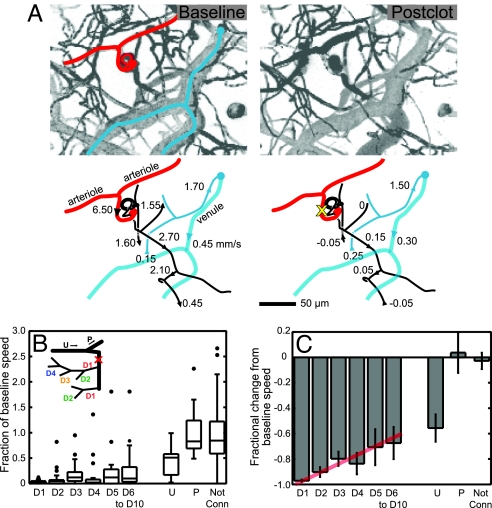
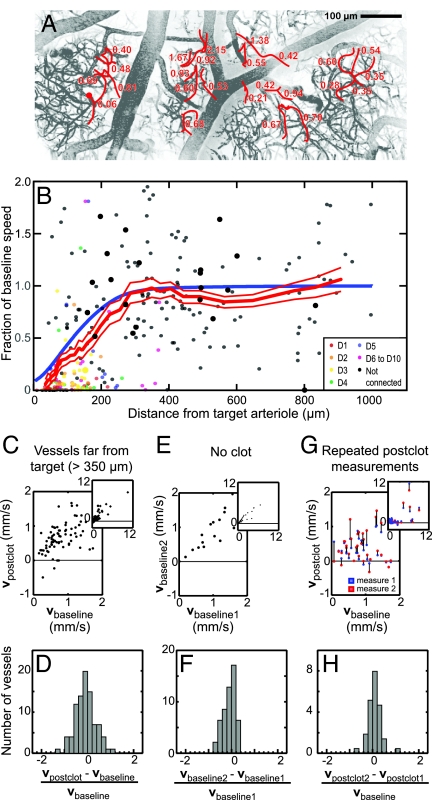
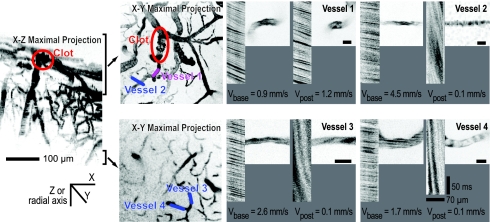
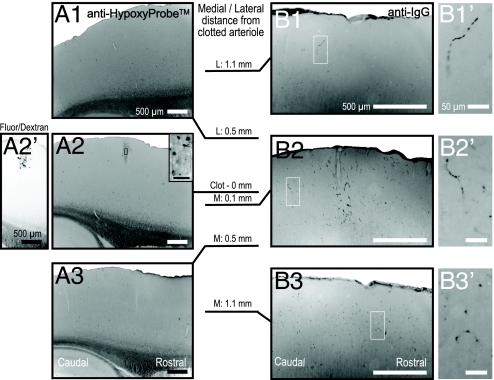
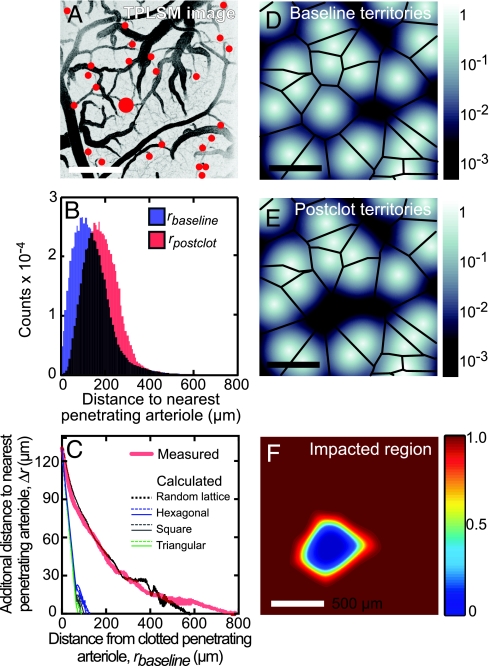
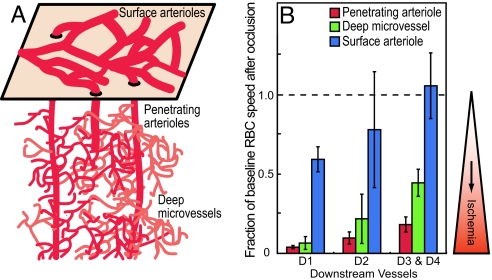
Penetrating arterioles bridge the mesh of communicating arterioles on the surface of cortex with the subsurface microvascular bed that feeds the underlying neural tissue. We tested the conjecture that penetrating arterioles, which are positioned to regulate the delivery of blood, are loci of severe ischemia in the event of occlusion. Focal photothrombosis was used to occlude single penetrating arterioles in rat parietal cortex, and the resultant changes in flow of red blood cells were measured with two-photon laser-scanning microscopy in individual subsurface microvessels that surround the occlusion. We observed that the average flow of red blood cells nearly stalls adjacent to the occlusion and remains within 30% of its baseline value in vessels as far as 10 branch points downstream from the occlusion. Preservation of average flow emerges 350 mum away; this length scale is consistent with the spatial distribution of penetrating arterioles. We conclude that penetrating arterioles are a bottleneck in the supply of blood to neocortex, at least to superficial layers.


Conflict of interest statement

The authors declare no conflict of interest.

Figures

Fig. 1.
Fig. 1.
Induction of clots in penetrating arterioles by photothrombosis. (A) Schematic of experimental set-up. Green laser light is focused into a penetrating arteriole by a microscope objective concurrent with TPLSM of the vasculature. (B and C) Maximal projections in the tangential (B) and sagittal (C) directions of image stacks through a penetrating vessel clot; schematics indicate the directions and volumes of projection. The clot is visualized as a dark mass in the target vessel that is often surrounded by bright areas of stalled, labeled plasma. The images are inverted for clarity. B Inset shows tangential view before irradiation.
Fig. 2.
Fig. 2.
Blood-flow changes categorized by topology. (A) Projections of image stacks in the vicinity of the occluded arteriole and schematics of RBC velocity before (Upper) and after (Lower) clot generation in a penetrating arteriole. The target vessel is marked by a yellow X and spirals into the parenchyma. Negative numbers indicate flow direction has reversed in direction after clot relative to baseline. (B) The fraction of baseline speed after the clot across all measurements. Each box contains the middle two quartiles of the data, middle-line segment indicates median, whiskers indicate acceptable range of data, and dots indicate outliers that are outside the range of the middle two quartiles ± 1.5 times the interquartile distance. Downstream branches are grouped by number of branches from target penetrating vessel (D1–D10), as indicated in schematic on the left. Upstream (U), parallel (P), and vessels that had no connection to the target vessel visible in TPLSM stacks are grouped separately. (C) Fractional change from baseline speed vs. connectivity. We show the mean values and the SEM. The red line is a guide to highlight the trend in the data.
Fig. 3.
Fig. 3.
Distance dependences of changes in blood flow after an occlusion. (A) Maximal projection of vessels across the cortex, with the fraction of baseline RBC speed after photothrombotic clot indicated. The clotted penetrating arteriole is indicated by the red circle. (B) Fraction of baseline RBC speed after the occlusion vs. distance from the occluded arteriole. The connectivity of the measured vessels is color-coded, as indicated. The thick red line through the data is the smoothed response averaged over a window that included 50 points, with ±1 SEM limits indicated by the thin red lines, and the blue line is the prediction of the change in RBC speed from a model with an exponential spatial distribution for the flow away from a blocked penetrating arteriole (Fig. 6). Large dots are from the case illustrated in Fig. 5. (C and D) Data graphs (C) and histogram (D) of changes in RBC speed induced by a clot >350 μm away from the measured vessels. Two outliers, with relative speeds of 2.6 and −2.8, were excluded from analysis in D. (E and F) The inherent variability in two measurements separated by 30–60 min, with no clot present. (G and H) The inherent variability in two measurements separated by 30–60 min, with both measurements taken after a clot in the targeted arteriole was formed. The first and second measurements after induction of the clot are shown in blue and red, respectively, with black lines linking measurements on the same vessel. Insets show the full range of the data.
Fig. 4.
Fig. 4.
Blood flow in vessels in the immediate neighborhood of the clot. Side projection in the coronal (x-z) plane of image stacks around a penetrating arteriole clot (yellow ellipse). The depth of the projections in the tangential (x-y) plane is noted and the line segments indicate specific microvessels whose velocity, and spatial profile was measured before and after the occlusion. High-magnification images and line-scan data for indicated vessels are shown before and after induction of a clot. For the latter data, the nonfluorescent RBCs appear as dark streaks on a bright background; the sign and magnitude of the slope of the streaks reflects the direction and speed, respectively, of RBC motion.
Fig. 5.
Fig. 5.
Tissue reactions in region of occluded penetrating arteriole. Sagittal section series taken across a 2.2-mm span centered on the fluorescent vessels that demarcate the core territory of the clotted arteriole (A2′, inverted image). These sections relate to the experiment that gave rise to the large dots in Fig. 3B. (A) Sections stained to localize tissue hypoxia demonstrate a confined high-density of staining at the level of the center of this series. The location of the clot is confirmed by trapped fluorescein/dextran (A2′). (B) Sections stained for immunoreactivity to IgG illustrate that vessel leakiness (B1′, B2′, and B3′) is concentrated at the center of this series (B2) yet extends up to 1.1 mm in medial and lateral directions.
Fig. 6.
Fig. 6.
Spatial analysis of vascular territories. (A) Image of the surface vasculature with penetrating arterioles marked with red dots; largest for the occluded arteriole. (B) Histograms of distances from pixels in the images to the nearest penetrating arteriole (rbaseline, blue) and the second-nearest arteriole (rbaseline, red). (C) The difference in radial distance from the first- and second-nearest penetrating arteriole, Δr, as a function of distance from the nearest arteriole, rbaseline (red curve). The calculation was performed for penetrating arteriole locations that were randomly assigned while maintaining a mean density of arterioles equal to the measured value (black curve) and for arterioles arranged in regular patterns, i.e., hexagonal (blue curve), square (gray curve), and triangular (green curve) lattices; see SI Text. (DF) Model of blood flow from penetrating arterioles, in which the contribution of flow in the tissue was described by an exponential decay, i.e., e−r/λ′, where r is the radial distance from the arteriole, and λ′ = 40 μm. The calculated sum of the flow from all penetrating arterioles, located as in A, is shown in D. The calculated sum of the flow with an occluded arteriole, modeled by the removal of the arteriole marked in red in A, is shown in E. Black lines in D and E demarcate the pixels that are equidistant from more than one arteriole. The calculated ratio of blood flow that remains after occlusion of a penetrating arteriole (A) is shown in F.
Fig. 7.
Fig. 7.
Summary of flow changes from occlusions at different levels of cortical angioarchitecture. (A) Schematic of the highly interconnected surface network of arterioles and tortuous network of microvessels below the surface. (B) Bars show the mean and SEM of fraction of baseline RBC speed after occlusion of either penetrating arterioles (this work), deep microvessels (8), or surface communicating arterioles (2) for vessels at different downstream branches relative to the occluded vessel.

References

    1. Brozici M, van der Zwain A, Hillen B. Stroke. 2003;34:2750–2762. - PubMed
    1. Schaffer CB, Friedman B, Nishimura N, Schroeder LF, Tsai PS, Ebner FF, Lyden PD, Kleinfeld D. PLoS Biol. 2006;4:e22. - PMC - PubMed
    1. Scremin OU. In: The Rat Nervous System. Paxinos G, editor. San Diego: Academic; 1995. pp. 3–35.
    1. Moody DM, Bell MA, Challa VR. Am J Neuroradiol. 1990;11:431–439. - PMC - PubMed
    1. Woolsey TA, Rovainen CM, Cox SB, Henger MH, Liange GE, Liu D, Moskalenko YE, Sui J, Wei L. Cereb Cortex. 1996;6:647–660. - PubMed

Publication types

LinkOut - more resources