

Structure and orientation of the Mn4Ca cluster in plant photosystem II membranes studied by polarized range-extended x-ray absorption spectroscopy
- PMID: 17190828
- PMCID: PMC3962024
- DOI: 10.1074/jbc.M610505200
Structure and orientation of the Mn4Ca cluster in plant photosystem II membranes studied by polarized range-extended x-ray absorption spectroscopy
Abstract
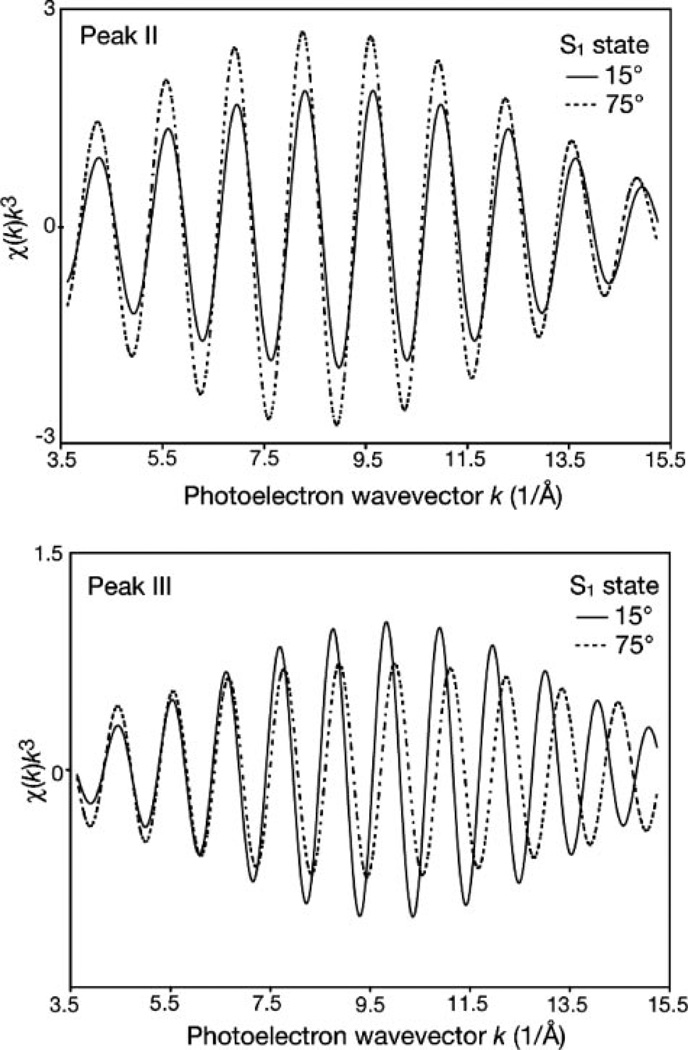
X-ray absorption spectroscopy has provided important insights into the structure and function of the Mn(4)Ca cluster in the oxygen-evolving complex of Photosystem II (PS II). The range of manganese extended x-ray absorption fine structure data collected from PS II until now has been, however, limited by the presence of iron in PS II. Using a crystal spectrometer with high energy resolution to detect solely the manganese Kalpha fluorescence, we are able to extend the extended x-ray absorption fine structure range beyond the onset of the iron absorption edge. This results in improvement in resolution of the manganese-backscatterer distances in PS II from 0.14 to 0.09A(.) The high resolution data obtained from oriented spinach PS II membranes in the S(1) state show that there are three di-mu-oxo-bridged manganese-manganese distances of approximately 2.7 and approximately 2.8A in a 2:1 ratio and that these three manganese-manganese vectors are aligned at an average orientation of approximately 60 degrees relative to the membrane normal. Furthermore, we are able to observe the separation of the Fourier peaks corresponding to the approximately 3.2A manganese-manganese and the approximately 3.4A manganese-calcium interactions in oriented PS II samples and determine their orientation relative to the membrane normal. The average of the manganese-calcium vectors at approximately 3.4A is aligned along the membrane normal, while the approximately 3.2A manganese-manganese vector is oriented near the membrane plane. A comparison of this structural information with the proposed Mn(4)Ca cluster models based on spectroscopic and diffraction data provides input for refining and selecting among these models.
Figures


Similar articles
-
Structural consequences of ammonia binding to the manganese center of the photosynthetic oxygen-evolving complex: an X-ray absorption spectroscopy study of isotropic and oriented photosystem II particles.Biochemistry. 1995 Apr 18;34(15):5274-87. doi: 10.1021/bi00015a043. Biochemistry. 1995. PMID: 7711049
-
High-resolution Mn EXAFS of the oxygen-evolving complex in photosystem II: structural implications for the Mn4Ca cluster.J Am Chem Soc. 2005 Nov 2;127(43):14974-5. doi: 10.1021/ja054873a. J Am Chem Soc. 2005. PMID: 16248606 Free PMC article.
-
Orientation of the oxygen-evolving manganese complex in a photosystem II membrane preparation: an X-ray absorption spectroscopy study.Biochemistry. 1994 Aug 16;33(32):9712-21. doi: 10.1021/bi00198a042. Biochemistry. 1994. PMID: 8068650
-
High-resolution structure of the photosynthetic Mn4Ca catalyst from X-ray spectroscopy.Philos Trans R Soc Lond B Biol Sci. 2008 Mar 27;363(1494):1139-47; discussion 1147. doi: 10.1098/rstb.2007.2209. Philos Trans R Soc Lond B Biol Sci. 2008. PMID: 17954437 Free PMC article. Review.
-
X-ray spectroscopy of the Mn4Ca cluster in the water-oxidation complex of Photosystem II.Photosynth Res. 2005;85(1):73-86. doi: 10.1007/s11120-005-0638-9. Photosynth Res. 2005. PMID: 15977060 Free PMC article. Review.
Cited by
-
Structural changes of the oxygen-evolving complex in photosystem II during the catalytic cycle.J Biol Chem. 2013 Aug 2;288(31):22607-20. doi: 10.1074/jbc.M113.476622. Epub 2013 Jun 13. J Biol Chem. 2013. PMID: 23766513 Free PMC article.
-
Altered structure of the Mn4Ca cluster in the oxygen-evolving complex of photosystem II by a histidine ligand mutation.J Biol Chem. 2011 Mar 18;286(11):9257-67. doi: 10.1074/jbc.M110.205740. Epub 2011 Jan 13. J Biol Chem. 2011. PMID: 21233216 Free PMC article.
-
X-ray absorption spectroscopy.Photosynth Res. 2009 Nov-Dec;102(2-3):241-54. doi: 10.1007/s11120-009-9473-8. Photosynth Res. 2009. PMID: 19653117 Free PMC article. Review.
-
Pulse electron paramagnetic resonance studies of the interaction of methanol with the S2 state of the Mn4O5Ca cluster of photosystem II.Biochemistry. 2014 Dec 23;53(50):7914-28. doi: 10.1021/bi501323h. Epub 2014 Dec 11. Biochemistry. 2014. PMID: 25441091 Free PMC article.
-
Why did Nature choose manganese to make oxygen?Philos Trans R Soc Lond B Biol Sci. 2008 Mar 27;363(1494):1263-70; discussion 1270. doi: 10.1098/rstb.2007.2223. Philos Trans R Soc Lond B Biol Sci. 2008. PMID: 17971329 Free PMC article. Review.
References
-
- Debus RJ. Biochim. Biophys. Acta. 1992;1102:269–352. - PubMed
-
- Rutherford AW, Zimmermann J-L, Boussac A. In: The Photosystems: Structure, Function, and Molecular Biology. Barber J, editor. BV Amsterdam: Elsevier Science Publishers; 1992. pp. 179–229.
-
- Ort DR, Yocum CF, editors. Oxygenic Photosynthesis: The Light Reactions. The Netherlands: Kluwer Academic Publishers, Dordrecht; 1996.
-
- Wydrzynski T, Satoh S. Photosystem II: The Light-Driven Water:Plastoquinone Oxidoreductase. The Netherlands: Springer, Dordrecht; 2005.
-
- Kok B, Forbush B, McGloin M. Photochem. Photobiol. 1970;11:457–475. - PubMed
Publication types
MeSH terms
Substances
Grants and funding
LinkOut - more resources
Full Text Sources
Other Literature Sources
Research Materials
