. 2007 Jan 22;204(1):25-31.
doi: 10.1084/jem.20061303. Epub 2006 Dec 26.

A critical role for the autophagy gene Atg5 in T cell survival and proliferation

Affiliations

A critical role for the autophagy gene Atg5 in T cell survival and proliferation

Heather H Pua et al. J Exp Med. .

Abstract

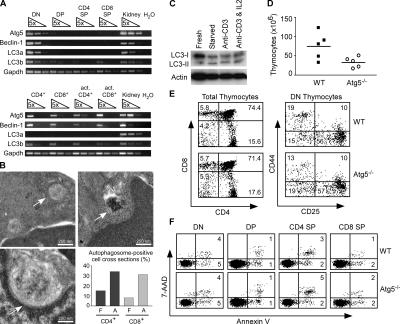
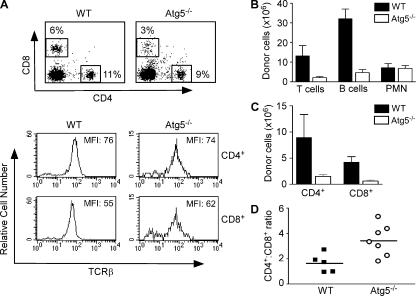
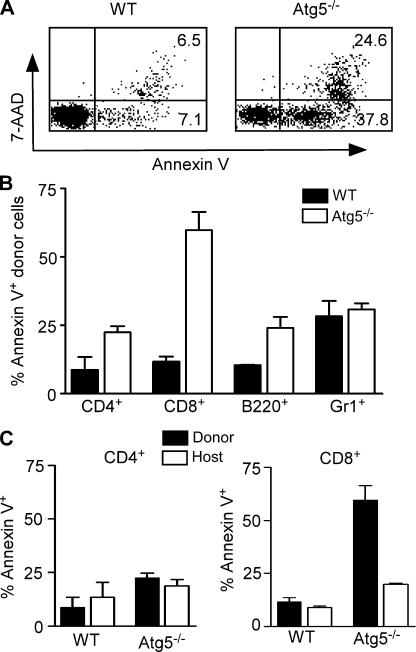
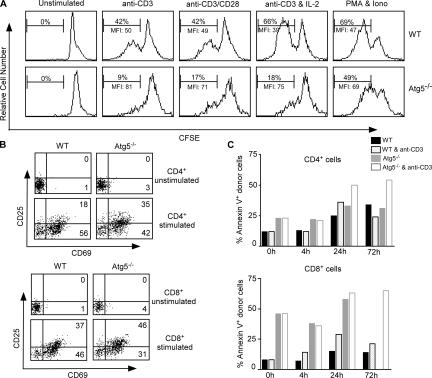
Macroautophagy (hereafter referred to as autophagy) is a well-conserved intracellular degradation process. Recent studies examining cells lacking the autophagy genes Atg5 and Atg7 have demonstrated that autophagy plays essential roles in cell survival during starvation, in innate cell clearance of microbial pathogens, and in neural cell maintenance. However, the role of autophagy in T lymphocyte development and survival is not known. Here, we demonstrate that autophagosomes form in primary mouse T lymphocytes. By generating Atg5-/- chimeric mice, we found that Atg5-deficient T lymphocytes underwent full maturation. However, the numbers of total thymocytes and peripheral T and B lymphocytes were reduced in Atg5 chimeras. In the periphery, Atg5-/- CD8+ T lymphocytes displayed dramatically increased cell death. Furthermore, Atg5-/- CD4+ and CD8+ T cells failed to undergo efficient proliferation after TCR stimulation. These results demonstrate a critical role for Atg5 in multiple aspects of lymphocyte development and function and suggest that autophagy may be essential for both T lymphocyte survival and proliferation.


Figures

Figure 1.
Figure 1.
Atg5−/− thymocytes are reduced in number but develop normally. (A) Rag-2−/− DN thymocytes, sorted DP, CD4+ SP, CD8+ SP, and peripheral T cell subsets from C57BL/6 mice were analyzed for the expression of autophagy genes by semiquantitative RT-PCR. Both sorted CD4+ and CD8+ peripheral T cells were activated in vitro for 2 d with anti-CD3 and subjected to RT-PCR analysis. (B) Transmission electron microscopy of peripheral T cells. Freshly isolated (F) and anti-CD3–activated (A) CD4+ and CD8+ T cells (n = 50) were cross sectioned and analyzed for the presence of autophagosomes (arrows). Activated cells were cultured in vitro for 2 d with anti-CD3. (C) T cell immunoblot for LC3. Purified T cells from C57BL/6 mice were either immediately lysed or amino acid starved in vitro for 4 h in a balanced salt solution, or stimulated with plate-bound anti-CD3 with or without hIL-2 (100 U/ml) for 16 h. The lysates were probed for LC3 processing. Actin serves as a loading control. (D) Total thymocyte number in Atg5−/− and wild-type chimeras. Circles and squares represent individual mice. P = 0.04. (E) FACS profile of Atg5−/− thymocytes. Total thymocytes were stained with anti-CD4 and anti-CD8. DN thymocytes were pregated on CD3CD4CD8 cells. (F) FACS analysis of thymocyte apoptosis. Thymocytes were stained with CD4, CD8, 7-AAD, and annexin V. Numbers indicate the percentage of cells in each region.
Figure 2.
Figure 2.
Defective peripheral lymphocyte compartment in Atg5−/− chimeras. (A) FACS profiles of donor-derived CD4+ and CD8+ T cells in the spleens of Atg5−/− and wild-type chimeric mice 6–10 wk after reconstitution. All cells are pregated on CD45.2+ donor-derived cells. (B) The numbers of T cells, B cells, and neutrophils in the spleen of Atg5−/− and wild-type chimeras. The numbers are derived from multiplying the percentage of CD4+ and CD8+ T cells, B220+, or Gr-1+CD11b+ CD45.2+ cells by the total numbers of splenocytes. p values for comparison between Atg5−/− and wild-type chimeras are: T cells, P = 0.0267; B cells, P = 0.0001; PMN, P = 0.8785. (C) The numbers of CD4+ and CD8+ T lymphocytes in the spleen of Atg5−/− and wild-type chimeras. CD4+ T cells, P = 0.0678; CD8+ T cells, P = 0.002. (D) The CD4+ to CD8+ T cell ratio in Atg5−/− and wild-type chimeras. Shown are data from individual mice. P = 0.0163. All p values are derived from unpaired, two-tailed Student's t test.
Figure 3.
Figure 3.
Selective survival defect in Atg5−/− CD8+ T cells. (A) FACS analysis of CD8+ T cell apoptosis. Donor-derived CD8+ T cells in Atg5−/− and wild-type chimeras were stained with 7-AAD and PE–annexin V. Numbers indicate the percentage of cells in each region. (B). Apoptotic rates of various cell populations in Atg5−/− and wild-type chimeras. Donor-derived cells (CD45.2+) were stained using the indicated lineage markers plus PE–annexin V and analyzed by FACS. CD8+ T cells, P = 0.0118; CD4+, P = 0.0544; B220+, P = 0.0826; Gr1+ cells, P = 0.6605. n = 3. (C) Apoptotic rates of donor-derived and host long-term surviving CD4+ and CD8+ T cells. p values for donor versus host T cells in Atg5−/− chimeras: CD4+ T cells, P = 0.72; CD8+ T cells, P = 0.004.
Figure 4.
Figure 4.
Impaired proliferation of Atg5−/− T cells upon anti-CD3 stimulation. (A) Proliferation of Atg5−/− and wild-type CD4+ T cells upon TCR stimulation. Splenocytes from control and Atg5−/− chimeras were labeled with CFSE and stimulated under the following conditions for 3 d: 5 μg/ml of plate-bound anti-CD3, or plus 1 μg/ml plate-bound anti-CD28, or plus 100 U/ml of recombinant IL-2, or 10 ng/ml PMA plus 300 ng/ml of ionomycin. Shown are the percentage of cells with diluted CFSE staining and the mean fluorescence intensity of the proliferating population. (B) Up-regulation of CD25 and CD69 on Atg5−/− and wild-type T cells after overnight stimulation with plate-bound anti-CD3. (C) Apoptosis rates of Atg5−/− and wild-type T cells after TCR stimulation. Total splenocytes were cultured either in media alone or with 5 μg/ml of plate bound anti-CD3 for the indicated times. Apoptosis was measured by annexin V staining. Data are representative of two experiments.

Similar articles

Cited by

References

    1. Mizushima, N., Y. Ohsumi, and T. Yoshimori. 2002. Autophagosome formation in mammalian cells. Cell Struct. Funct. 27:421–429. - PubMed
    1. Tsukada, M., and Y. Ohsumi. 1993. Isolation and characterization of autophagy-defective mutants of Saccharomyces cerevisiae. FEBS Lett. 333:169–174. - PubMed
    1. Mizushima, N. 2005. The pleiotropic role of autophagy: from protein metabolism to bactericide. Cell Death Differ. 12(Suppl 2):1535–1541. - PubMed
    1. Lum, J.J., R.J. DeBerardinis, and C.B. Thompson. 2005. Autophagy in metazoans: cell survival in the land of plenty. Nat. Rev. Mol. Cell Biol. 6:439–448. - PubMed
    1. Kuma, A., M. Hatano, M. Matsui, A. Yamamoto, H. Nakaya, T. Yoshimori, Y. Ohsumi, T. Tokuhisa, and N. Mizushima. 2004. The role of autophagy during the early neonatal starvation period. Nature. 432:1032–1036. - PubMed

Publication types

MeSH terms