

Do conditional reinforcers count?
- PMID: 17191753
- PMCID: PMC1679975
- DOI: 10.1901/jeab.2006.56-05
Do conditional reinforcers count?
Abstract
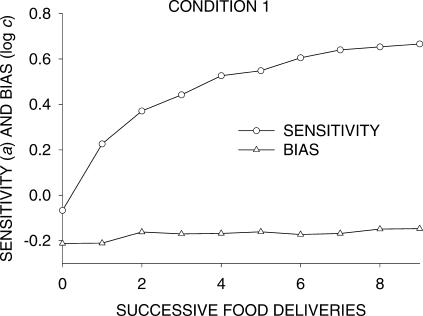
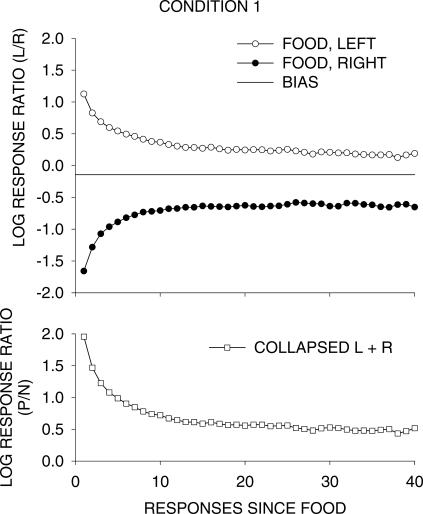
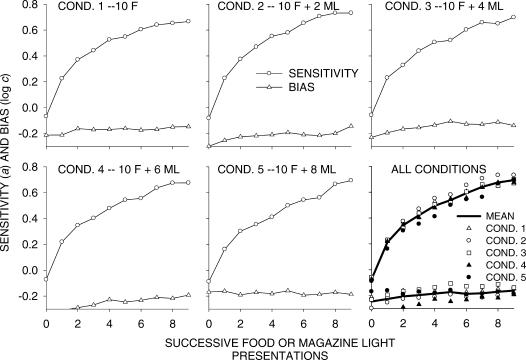
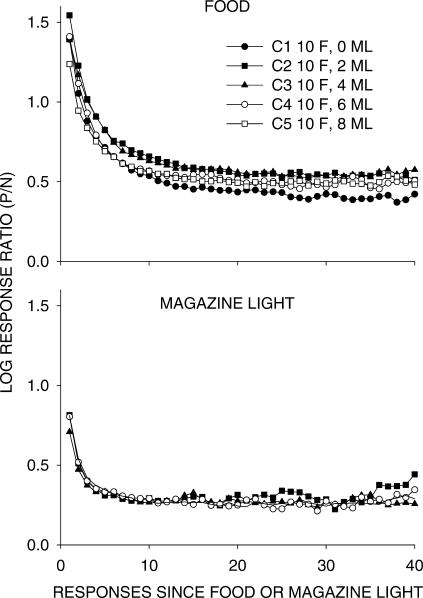
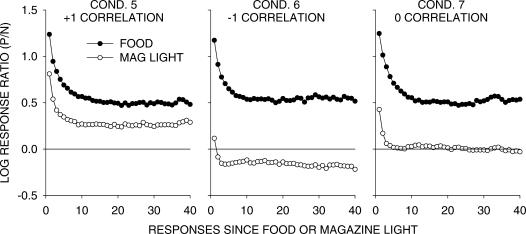
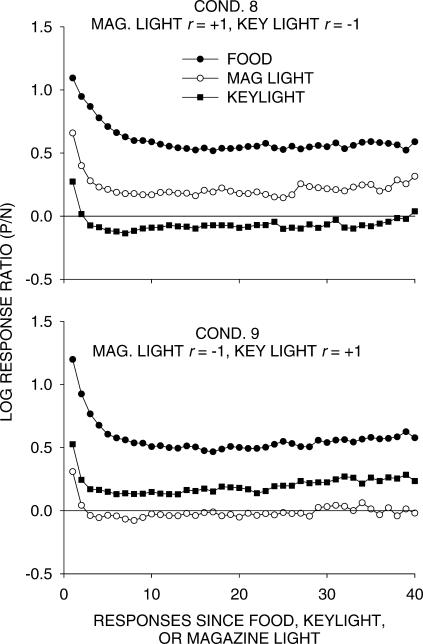
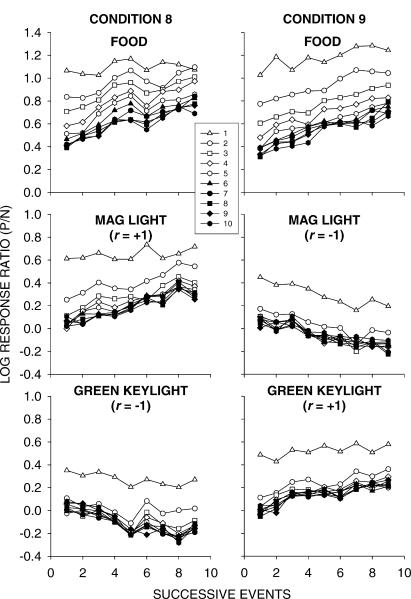
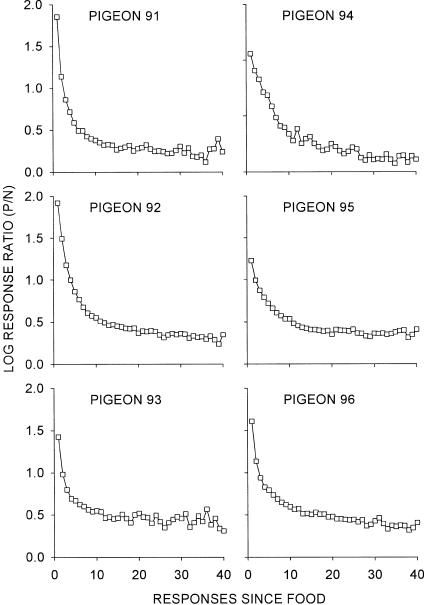
Six pigeons were trained on a procedure in which seven components arranged different food-delivery ratios on concurrent variable-interval schedules each session. The components were unsignaled, lasted for 10 food deliveries, and occurred in random order with a 60-s blackout between components. The schedules were arranged using a switching-key procedure in which two responses on a center key changed the schedules and associated stimuli on two side keys. In Experiment 1, over five conditions, an increasing proportion of food deliveries accompanied by a magazine light was replaced with the presentation of the magazine light only. Local analyses of preference showed preference pulses toward the alternative that had just produced either a food-plus-magazine-light or magazine-light-only presentation, but pulses after food deliveries were always greater than those after magazine lights. Increasing proportions of magazine lights did not change the size of preference pulses after food or magazine-light presentations. Experiment 2 investigated the effects of correlations between food ratios and magazine-light ratios: In Condition 6, magazine-light ratios in components were inversely correlated (-1.0) with food ratios, and in Condition 7, magazine-light ratios were uncorrelated with food ratios. In Conditions 8 and 9, pecks also produced occasional 2.5-s flashes of a green keylight. In Condition 8, food and magazine-light ratios were correlated 1.0 whereas food and green-key ratios were correlated -1.0. In Condition 9, food and green-key ratios were correlated 1.0 whereas food and magazine-light ratios were correlated -1.0. Preference pulses toward alternatives after magazine lights and green keys depended on the correlation between these event ratios and the food ratios: If the ratios were correlated +1.0, positive preference pulses resulted; if the correlation was -1.0, preference pulses were negative. These results suggest that the Law of Effect has more to do with events signaling consequences than with strengthening responses.
Figures
Similar articles
-
Mechanisms underlying the effects of unsignaled delayed reinforcement on key pecking of pigeons under variable-interval schedules.J Exp Anal Behav. 1998 Mar;69(2):103-22. doi: 10.1901/jeab.1998.69-103. J Exp Anal Behav. 1998. PMID: 9540229 Free PMC article.
-
Choice in a variable environment: effects of blackout duration and extinction between components.J Exp Anal Behav. 2002 Jan;77(1):65-89. doi: 10.1901/jeab.2002.77-65. J Exp Anal Behav. 2002. PMID: 11831784 Free PMC article.
-
Concurrent schedules: reinforcer magnitude effects.J Exp Anal Behav. 2003 May;79(3):351-65. doi: 10.1901/jeab.2003.79-351. J Exp Anal Behav. 2003. PMID: 12908762 Free PMC article.
-
Norse Magazine for Medical Science.Br Foreign Med Chir Rev. 1853 Oct;12(24):434-443. Br Foreign Med Chir Rev. 1853. PMID: 30164517 Free PMC article. Review. No abstract available.
-
Norwegian Magazine for Medical Sciences.Br Foreign Med Chir Rev. 1863 Apr;31(62):369-373. Br Foreign Med Chir Rev. 1863. PMID: 30163419 Free PMC article. Review. No abstract available.
Cited by
-
Moving Beyond Reinforcement and Response Strength.Behav Anal. 2017 Jun 19;40(1):107-121. doi: 10.1007/s40614-017-0092-y. eCollection 2017 Jun. Behav Anal. 2017. PMID: 31976956 Free PMC article.
-
Rethinking reinforcement: allocation, induction, and contingency.J Exp Anal Behav. 2012 Jan;97(1):101-24. doi: 10.1901/jeab.2012.97-101. J Exp Anal Behav. 2012. PMID: 22287807 Free PMC article.
-
Stimulus effects on local preference: stimulus-response contingencies, stimulus-food pairing, and stimulus-food correlation.J Exp Anal Behav. 2010 Jan;93(1):45-59. doi: 10.1901/jeab.2010.93-45. J Exp Anal Behav. 2010. PMID: 20676267 Free PMC article.
-
On the "Strength" of Behavior.Perspect Behav Sci. 2020 Nov 10;43(4):677-696. doi: 10.1007/s40614-020-00269-5. eCollection 2020 Dec. Perspect Behav Sci. 2020. PMID: 33376947 Free PMC article.
-
Changing course: a reply.Behav Anal. 2013 Spring;36(1):161-5. doi: 10.1007/BF03392300. Behav Anal. 2013. PMID: 25729140 Free PMC article. No abstract available.
References
-
- Azrin N.H, Holz W.C. Punishment. In: Honig W.K, editor. Operant behavior: Areas of research and application. New York: Appleton-Century-Crofts; 1966. pp. 380–447.
-
- Baum W.M. Understanding behaviorism: Behavior, culture, and evolution. Malden, MA: Blackwell Publishing; 2005.
MeSH terms
LinkOut - more resources
Full Text Sources
