. 2006 Nov;86(3):285-305.
doi: 10.1901/jeab.2006.17-06.

Effects of D-amphetamine and ethanol on variable and repetitive key-peck sequences in pigeons

Affiliations

Effects of D-amphetamine and ethanol on variable and repetitive key-peck sequences in pigeons

Ryan D Ward et al. J Exp Anal Behav. 2006 Nov.

Abstract

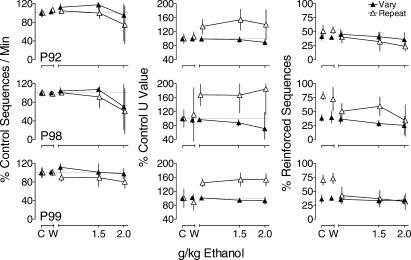
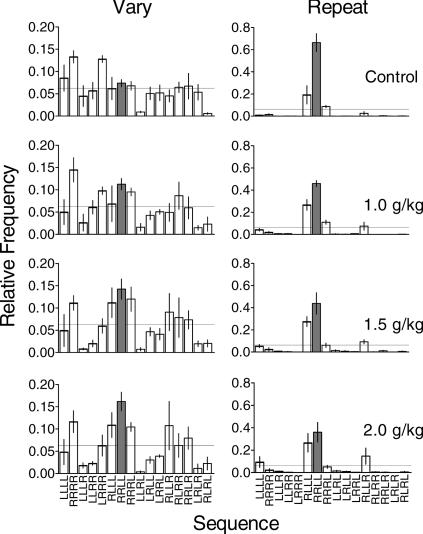
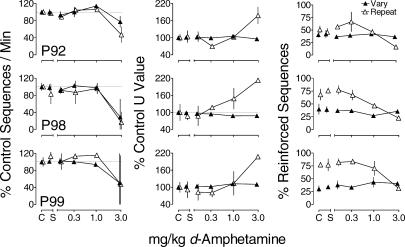
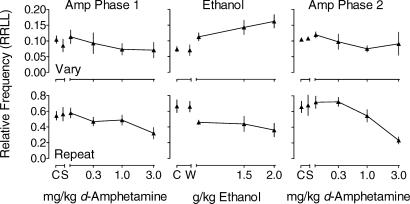
This experiment assessed the effects of d-amphetamine and ethanol on reinforced variable and repetitive key-peck sequences in pigeons. Pigeons responded on two keys under a multiple schedule of Repeat and Vary components. In the Repeat component, completion of a target sequence of right, right, left, left resulted in food. In the Vary component, 4-peck sequences differing from the previous 10 produced food. d-Amphetamine (0.1-3.0 mg/kg, i.m.) was administered in two separate phases, separated by ethanol administration (1.0-2.0 g/kg, i.g.). Under control conditions, measures of variability were high in the Vary component, and lower in the Repeat component. Following administration of the highest dose of d-amphetamine, but not ethanol, response rates decreased in both components. d-Amphetamine and ethanol tended to increase overall sequence variability in the Repeat component, and had less of an effect in the Vary component. Performance in the Repeat component during Phase 2 of d-amphetamine administration was more disrupted than during Phase 1. Measures of variability and repetition based on shifts in the relative frequency distributions of the 16 possible keypeck sequences differed from those based on the overall measure of variability, highlighting the importance of considering both molar and molecular measures when assessing the effects of drugs on reinforced variability and repetition. In addition, the shifts in the relative frequency distribution of response sequences suggest that d-amphetamine produced decrements in repeat performance by decreasing discriminative control within response sequences, whereas ethanol decreased repeat performance by decreasing discriminability between components as well as discriminative control within response sequences.


Figures

Fig 1
Fig 1. Mean sequences/min (left column), U value (center column; see text for calculation), and percent reinforced sequences (right column) as a function of d-amphetamine for each pigeon during the Vary (filled triangles) and Repeat (unfilled triangles) components during the first three determinations of the effects of d-amphetamine (Phase 1).
Data for sequences/min and U value are expressed as percent control. Unconnected points show means for all control (C) and saline (S) sessions. Lines connect points showing means across doses of d-amphetamine. Dotted lines indicate 100% of control performance. Vertical bars indicate one standard deviation above and below the mean. In some cases, the variability around a point is obscured by the point. Data points for the Vary and Repeat components are offset slightly on the x-axis for clarity.
Fig 2
Fig 2. Mean relative frequency of each possible four-response sequence averaged across pigeons in the Vary (left column) and Repeat (right column) components during control sessions and across doses of d-amphetamine.
Dashed lines indicate the relative frequency of each possible sequence predicted by chance (.0625). All sequences are plotted on the x-axis from left to right in order of the number of key changeovers required with the leftmost sequence requiring no changeovers and the rightmost sequence requiring the greatest number of changeovers (cf. Doughty & Lattal, 2001). Vertical bars indicate one standard error above and below the mean. For clarity, y-axes are scaled differently for the Vary and Repeat components. In all panels, the target sequence from the Repeat component (RRLL) is shaded for ease of inspection.
Fig 3
Fig 3. Mean sequences/min (left column), U value (center column), and percent reinforced sequences (right column) as a function of ethanol.
Unconnected points show means for all control (C) and water (W) sessions. Other details as in Figure 1.
Fig 4
Fig 4. Mean relative frequency of each possible four-response sequence in the Vary (left column) and Repeat (right column) components during control sessions and across all doses of ethanol.
Other details as in Figure 2.
Fig 5
Fig 5. Mean sequences/min (left column), U value (center column), and percent reinforced sequences (right column) as a function of d-amphetamine for each pigeon during the fourth and fifth determinations of the effects of d-amphetamine (Phase 2).
Other details as in Figure 1.
Fig 6
Fig 6. Mean relative frequency of each possible four-response sequence in the Vary (left column) and Repeat (right column) components during control sessions and across doses of d-amphetamine during the fourth and fifth determinations (Phase 2).
Other details as in Figure 2.
Fig 7
Fig 7. Mean relative frequency of the sequence RRLL averaged across pigeons in the Vary (top row) and Repeat (bottom row) components as a function of d-amphetamine during Phase 1 (left column) and Phase 2 (right column) of d-amphetamine administration and as a function of ethanol (center column).
The data are taken from the Appendix (with the exception of saline). In all panels, unconnected data points show means for all control and vehicle sessions. Lines connect data points showing means across doses of d-amphetamine and ethanol. Vertical lines indicate one standard error above and below the mean.

Similar articles

Cited by

References

    1. Baron S.P, Wright D, Wenger G.R. Effects of drugs of abuse and scopolamine on memory in rats: Delayed spatial alternation and matching to position. Psychopharmacology. 1998;137:7–14. - PubMed
    1. Blough D.S. The reinforcement of least frequent interresponse times. Journal of the Experimental Analysis of Behavior. 1966;9:581–591. - PMC - PubMed
    1. Bryant D, Church R.M. The determinants of random choice. Animal Learning & Behavior. 1974;2:245–248.
    1. Cohen L, Neuringer A, Rhodes D. Effects of ethanol on reinforced variations and repetitions by rats under a multiple schedule. Journal of the Experimental Analysis of Behavior. 1990;54:1–12. - PMC - PubMed
    1. Crow L.T. Ethanol-induced response stereotypy: Simple alternation, fixed-interval rates of response, and response location. Bulletin of the Psychonomic Society. 1982;19:169–172.

MeSH terms

LinkOut - more resources