. 2006 Dec 27:7:325.
doi: 10.1186/1471-2164-7-325.

Alternative splicing and differential gene expression in colon cancer detected by a whole genome exon array

Affiliations

Alternative splicing and differential gene expression in colon cancer detected by a whole genome exon array

Paul J Gardina et al. BMC Genomics. .

Abstract

Background: Alternative splicing is a mechanism for increasing protein diversity by excluding or including exons during post-transcriptional processing. Alternatively spliced proteins are particularly relevant in oncology since they may contribute to the etiology of cancer, provide selective drug targets, or serve as a marker set for cancer diagnosis. While conventional identification of splice variants generally targets individual genes, we present here a new exon-centric array (GeneChip Human Exon 1.0 ST) that allows genome-wide identification of differential splice variation, and concurrently provides a flexible and inclusive analysis of gene expression.

Results: We analyzed 20 paired tumor-normal colon cancer samples using a microarray designed to detect over one million putative exons that can be virtually assembled into potential gene-level transcripts according to various levels of prior supporting evidence. Analysis of high confidence (empirically supported) transcripts identified 160 differentially expressed genes, with 42 genes occupying a network impacting cell proliferation and another twenty nine genes with unknown functions. A more speculative analysis, including transcripts based solely on computational prediction, produced another 160 differentially expressed genes, three-fourths of which have no previous annotation. We also present a comparison of gene signal estimations from the Exon 1.0 ST and the U133 Plus 2.0 arrays. Novel splicing events were predicted by experimental algorithms that compare the relative contribution of each exon to the cognate transcript intensity in each tissue. The resulting candidate splice variants were validated with RT-PCR. We found nine genes that were differentially spliced between colon tumors and normal colon tissues, several of which have not been previously implicated in cancer. Top scoring candidates from our analysis were also found to substantially overlap with EST-based bioinformatic predictions of alternative splicing in cancer.

Conclusion: Differential expression of high confidence transcripts correlated extremely well with known cancer genes and pathways, suggesting that the more speculative transcripts, largely based solely on computational prediction and mostly with no previous annotation, might be novel targets in colon cancer. Five of the identified splicing events affect mediators of cytoskeletal organization (ACTN1, VCL, CALD1, CTTN, TPM1), two affect extracellular matrix proteins (FN1, COL6A3) and another participates in integrin signaling (SLC3A2). Altogether they form a pattern of colon-cancer specific alterations that may particularly impact cell motility.


Figures

Figure 1
Figure 1
Frequencies of signal values from the Exon and U133 Plus 2 Arrays. The distribution of log2 (signal + 16) values of transcript clusters are shown for the Exon Array (solid line) and the U133 Plus 2 Array (stippled line) for breast tissues.
Figure 2
Figure 2
Pairwise comparison of signals from the Exon and U133 Plus 2 Arrays. Each dot represents the log2 (signal + 16) values for the same transcript cluster from the Exon Array (x-axis) and the U133 Plus 2 Array (y-axis) for breast tissues. Bold lines at signal value 5 divide the plot into quadrants I-IV for reference.
Figure 3
Figure 3
A dense network of molecular interactions containing differentially expressed Core genes in colon cancer. Over- or under-expressed genes, respectively, are indicated by a blue or red disk above-right of the gene-product icon. Green or red lines represent stimulatory or inhibitory interactions, respectively. Many transcription factors (e.g., p53) and signaling kinases (e.g., ERK1) are excluded due to their multiplicity of connections. The general partitioning of the nodes into canonical pathways are shown as bold text.
Figure 4
Figure 4
Workflow for parallel gene-level and exon-level analyses. The workflow illustrates two parallel lines of analysis corresponding to gene-level (left) and exon-level (right) signal processing. The analyses converge at the level of MIDAS or the Splicing Index, which implement statistical testing for alternative splicing. Signal estimation and MIDAS occur within the ExACT software and the filtering is accomplished mainly with simple Perl scripts. Yellow boxes represent files or data sets and green boxes represent processes or programs. Solid lines represent the main data flow and dotted lines are auxiliary flows, mainly for filtering.
Figure 5
Figure 5
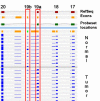
An example of probeset-level intensities from two mutually exclusive exons (19a and 19b) of ACTN1 in a genomic context. The probeset signals are normalized for each sample to the median signal for that sample across all the probesets in the view. This candidate splicing event was confirmed by RT-PCR. (BLIS viewer from Biotique.)
Figure 6
Figure 6
PCR validation of candidate splicing events. PCR products are derived from forward/reverse primers in well-annotated flanking regions as indicated under the gene name. The interpretation of each change in mobility is given to the right ("Incl", include; "Ext", extended). The sample numbers match those in the sample data information (see Methods). Note that in several cases, an unlabeled doublet band results from a heteroduplex forming between the PCR products. Controls are "Universal Total RNA" (Clontech), an independent colon RNA sample (BioChain) and a No Template Control ("NTC"). "M" is a DNA ladder marker.
Figure 7
Figure 7
PCR validation of previously reported colon cancer-specific splicing events. See Fig. 6 for description.
Figure 8
Figure 8
Network containing products of alternatively spliced genes in colon cancer. Proteins affected by alternative splicing are indicated with a red disk. Proteins concerned with cell or matrix adhesion are generally to the left while those concerned with cell motility and the actin cytoskeleton occupy the center and right. "PMCA4" is an alias for ATP2B4.

Similar articles

Cited by

References

    1. Black DL. Mechanisms of alternative pre-messenger RNA splicing. Annu Rev Biochem. 2003;72:291–336. doi: 10.1146/annurev.biochem.72.121801.161720. - DOI - PubMed
    1. Faustino NA, Cooper TA. Pre-mRNA splicing and human disease. Genes Dev. 2003;17:419–437. doi: 10.1101/gad.1048803. - DOI - PubMed
    1. Venables JP. Unbalanced alternative splicing and its significance in cancer. Bioessays. 2006;28:378–386. doi: 10.1002/bies.20390. - DOI - PubMed
    1. Finn L, Dougherty G, Finley G, Meisler A, Becich M, Cooper DL. Alternative splicing of CD44 pre-mRNA in human colorectal tumors. Biochem Biophys Res Commun. 1994;200:1015–1022. doi: 10.1006/bbrc.1994.1551. - DOI - PubMed
    1. Goodison S, Urquidi V, Tarin D. CD44 cell adhesion molecules. Mol Pathol. 1999;52:189–196. - PMC - PubMed

Publication types