Comparative Study
. 2006 Dec 27;26(52):13505-14.
doi: 10.1523/JNEUROSCI.3970-06.2006.

Bidirectional activity-dependent regulation of neuronal ion channel phosphorylation

Affiliations
Comparative Study

Bidirectional activity-dependent regulation of neuronal ion channel phosphorylation

Hiroaki Misonou et al. J Neurosci. .

Abstract

Activity-dependent dephosphorylation of neuronal Kv2.1 channels yields hyperpolarizing shifts in their voltage-dependent activation and homoeostatic suppression of neuronal excitability. We recently identified 16 phosphorylation sites that modulate Kv2.1 function. Here, we show that in mammalian neurons, compared with other regulated sites, such as serine (S)563, phosphorylation at S603 is supersensitive to calcineurin-mediated dephosphorylation in response to kainate-induced seizures in vivo, and brief glutamate stimulation of cultured hippocampal neurons. In vitro calcineurin digestion shows that supersensitivity of S603 dephosphorylation is an inherent property of Kv2.1. Conversely, suppression of neuronal activity by anesthetic in vivo causes hyperphosphorylation at S603 but not S563. Distinct regulation of individual phosphorylation sites allows for graded and bidirectional homeostatic regulation of Kv2.1 function. S603 phosphorylation represents a sensitive bidirectional biosensor of neuronal activity.


Figures

Figure 1.
Figure 1.
Characterization of the S563P and S603P phosphospecific anti-Kv2.1 antibodies. A, Analysis of anti-Kv2.1 phosphospecific antibodies against Kv2.1 dephosphorylation in response to brain ischemia. RBM fractions were prepared from rats treated without (C) or with CO2 gas. Proteins were extracted in lysis buffer, subjected to immunoprecipitation with the indicated antibodies, size fractionated by SDS-PAGE, and analyzed for Kv2.1 by immunoblotting with K89/34. Numbers to the left indicate mobility of molecular weight standards in kilodaltons. The bottom panel shows the respective line scan analysis of each immunoblot. B, Kv2.1 was immunopurified from detergent extracts of RBM with mouse monoclonal antibody D4/11, size fractionated by SDS-PAGE, immunoblotted, and probed with S563P, S603P, or KC antibodies. C, Immunoblot of mouse brain membrane fractions from wild-type and Kv2.1-deficient mice with S563P, S603P, or KC antibodies. WT, Wild type; H, heterozygous knock-out; KO, homozygous knock-out. D, RBM were incubated without (RBM) or with (AP) alkaline phosphatase for 2 h at 37°C. Proteins (20 μg/lane) were extracted in SDS sample buffer, size fractionated by SDS-PAGE, and analyzed for total Kv2.1 with S563P, S603P, or KC antibodies. The arrow indicates the fully phosphorylated (M r ≈ 120 kDa) form of Kv2.1, and the arrowhead points to the fully dephosphorylated form. E, Peptide adsorption of the phosphospecific antibodies. Blots of RBM (20 μg protein/lane) were probed with the phosphospecific antibodies after overnight incubation with their respective phosphorylated (P) or dephosphorylated (D) peptides.
Figure 2.
Figure 2.
Immunostaining of rat brain with phosphospecific antibodies. Rat brain sections were double immunofluorescence stained with S563P or S603P (red) together with K89/34 (Total; green). Images were taken by a fluorescence microscope equipped with ApoTome. A, Cerebral cortex. Note that some large pyramidal neurons in the layer V were stained more intensely than other neurons in the region. Scale bar, 50 μm. B, Pyramidal neurons in the subiculum. Overlaid images show the heterogeneity of S563 and S603 phosphorylation in Kv2.1 clusters. Scale bar, 10 μm.
Figure 3.
Figure 3.
Dephosphorylation of S563 and S603, and dispersion of Kv2.1 clusters, by brain ischemia. Rat brain sections prepared from control and CO2-treated rats were double immunofluorescence stained with S563P or S603P (red) together with K89/34 (Total; green). Images were taken by a fluorescence microscope equipped with ApoTome from the cerebral cortex. Scale bar, 10 μm.
Figure 4.
Figure 4.
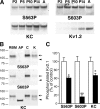
Differential regulation of brain Kv2.1 phosphorylation at S563 and S603. A, RBM fractions prepared from P2, P5, P10, P14, and adult animals were fractionated on SDS-PAGE and analyzed by immunoblotting with S563P, S603P, or KC, as indicated. Each lane contains 20 μg of protein. B, Dephosphorylation of Kv2.1 at S563 and S603 in kainate-induced seizure brains. Hippocampal membrane proteins (20 μg/lane) from control (C) and kainate-treated (K) animals were size fractionated by SDS-PAGE, and resultant immunoblots were probed with S563P, S603P, or KC as indicated. RBM, Rat whole brain membrane fraction; AP, RBM digested with alkaline phosphatase. The arrow indicates the position of the fully phosphorylated form of Kv2.1, and the arrowhead points to that of the fully dephosphorylated form. C, Levels of Kv2.1 with phosphorylation at S563 and S603. Hippocampal membrane fractions from three control (open bars) and three kainate-treated animals (filled bars) were used for the analysis. The level of the major (M r ≈ 120 kDa) phosphorylated form of Kv2.1 in the KC blot was also quantified. Data are mean ± SEM (n = 3). *p < 0.05 and **p < 0.005 versus control.
Figure 5.
Figure 5.
Dephosphorylation of S563 and S603, and dispersion of Kv2.1 clusters in cultured hippocampal neurons stimulated with glutamate. A, Cultured hippocampal neurons (21 DIV) were incubated without (Control) or with 10 μm glutamate (Glutamate) for 10 min, fixed with 4% paraformaldehyde, permeabilized, and double immunofluorescence stained with S563P or S603P (red) together with K89/34 (Total; green). Scale bar, 10 μm. B, Line scan analysis of immunofluorescence staining. The intensity of the fluorescence signal was measured over a 25 μm segment on the neuronal cell body at the sites indicated by the white lines in A. The signal intensity is presented on an arbitrary scale of 0–255 (black–white) plotted against distance (in micrometers).
Figure 6.
Figure 6.
Temporal dissection of dephosphorylation at S563 and S603 in glutamate-stimulated cultured hippocampal neurons. A, Cultured neurons were treated with 10 μm glutamate for 0, 1, 5, and 10 min at 37°C. Neuronal proteins were fractionated on SDS-PAGE and resultant immunoblots were analyzed for Kv2.1 by probing with S563P, S603P, or KC as indicated. Representative blots probed with each antibody are shown. For direct comparison of phosphorylation levels, blots were stripped and reprobed with different antibodies as described in Materials and Methods. B, Time course of dephosphorylation at S563 and S603. Signals of immunoreactive bands were quantified as described in Materials and Methods, and values were converted to percentages of control values and shown as levels of phosphorylation at S563 (filled circles) and S603 (open circles). Data are mean ± SEM (n = 3). The kinetics of the glutamate-stimulated decay of Kv2.1 dephosphorylation was fitted by exponential decay curves. *p < 0.02 versus control. Inset, Time course of loss of the M r ≈ 120 kDa band on the KC immunoblot. C, Modulation of Kv2.1-based I K. G 1/2 values (see Materials and Methods) for each time point after glutamate stimulation are shown in millivolts; values were fit with a sigmoidal curve. Inset, Representative conductance–voltage (GV) traces from control and glutamate-treated (10 min) neurons. V m, Membrane potential in millivolts. Data are mean ± SEM (n = 6). *p < 0.01 versus control.
Figure 7.
Figure 7.
Distinct sensitivity of S563 and S603 to calcineurin and protein kinases. A, Immunopurified Kv2.1 was incubated without (C) or with (PP) 25 U of recombinant human calcineurin for 2 h at 32°C and analyzed on immunoblot with S563P, S603P, or KC as indicated. Bottom panel, Relative levels of Kv2.1 phosphorylation at S563 and S603, and of the M r ≈ 120 kDa form of Kv2.1 after in vitro calcineurin dephosphorylation. Open bars, Control; filled bars, calcineurin treated. Data were from three independent experiments and are mean ± SEM (n = 3). *p < 0.02 and **p < 0.005 versus control. B, Staurosporine-mediated blockade of recovery of phosphorylation after glutamate stimulation. Cultured neurons were treated without (C) or with 10 μm glutamate for 10 min (Glu), washed twice, and then incubated without glutamate for 2 h to allow recovery of phosphorylation in the absence (Rec) or presence of 100 nm staurosporine (S). Neuronal proteins were fractionated on SDS-PAGE, and resultant immunoblots were analyzed for Kv2.1 by immunoblotting with S563P, S603P, or KC as indicated. C, In vitro phosphorylation of Kv2.1 by purified protein kinase C. Kv2.1 was purified from RBM, dephosphorylated by digestion with AP, incubated without (C) or with purified PKC for 1 h at 32°C, size fractionated by SDS-PAGE, and analyzed for Kv2.1 by immunoblotting with S563P, S603P, or KC antibodies. Lines indicate the different M r values of Kv2.1 with or without PKC incubation. D, Staurosporine-mediated blockade of functional recovery of Kv2.1. Cultured neurons were treated without (open circles) or with 10 μm glutamate for 10 min (closed circles), washed twice, and then incubated without glutamate for 2 h to allow recovery of phosphorylation in the absence (open diamond) or presence of staurosporine (closed diamond). Kv2.1/I K currents were recorded from five neurons for each condition. The membrane potential was held at –80 mV and depolarized from the holding potential of –80 mV to voltages between –70 and +80 mV in 10 mV increments for 200 ms. The plots show the conductance–voltage (GV) relationship of peak I K currents. Data are presented as mean ± SEM (n = 5).
Figure 8.
Figure 8.
Hyperphosphorylation of S603 of Kv2.1 by suppressing neuronal activity in vivo. A, RBM prepared from animals treated without (C) or with 50 mg/kg pentobarbital (P) were analyzed on immunoblot with S563P, S603P, or KC as indicated. B, Levels of phosphorylation at S563 and S603 of Kv2.1 were quantified. RBM from three control (open bars) and three anesthetized animals (filled bars) were used for the analysis. Data are mean ± SEM (n = 3). *p < 0.01 versus control.

Comment in

  • Ps in the (channel) pod are not alike..
    Noam Y, Baram TZ. Noam Y, et al. Epilepsy Curr. 2007 Sep-Oct;7(5):136-7. doi: 10.1111/j.1535-7511.2007.00203.x. Epilepsy Curr. 2007. PMID: 17998975 Free PMC article. No abstract available.

References

    1. Antonucci DE, Lim ST, Vassanelli S, Trimmer JS. Dynamic localization and clustering of dendritic Kv2.1 voltage-dependent potassium channels in developing hippocampal neurons. Neuroscience. 2001;108:69–81. - PubMed
    1. Bekkers JM. Distribution and activation of voltage-gated potassium channels in cell-attached and outside-out patches from large layer 5 cortical pyramidal neurons of the rat. J Physiol (Lond) 2000;525:611–620. - PMC - PubMed
    1. Chung HJ, Xia J, Scannevin RH, Zhang X, Huganir RL. Phosphorylation of the AMPA receptor subunit GluR2 differentially regulates its interaction with PDZ domain-containing proteins. J Neurosci. 2000;20:7258–7267. - PMC - PubMed
    1. Colbert CM, Pan E. Ion channel properties underlying axonal action potential initiation in pyramidal neurons. Nat Neurosci. 2002;5:533–538. - PubMed
    1. Covarrubias M, Wei A, Salkoff L, Vyas TB. Elimination of rapid potassium channel inactivation by phosphorylation of the inactivation gate. Neuron. 1994;13:1403–1412. - PMC - PubMed

Publication types

MeSH terms