

Posttranscriptional control is a strong factor enabling exclusive expression of surface antigens in Paramecium tetraurelia
- PMID: 17193923
- PMCID: PMC6032442
- DOI: 10.3727/000000006783991809
Posttranscriptional control is a strong factor enabling exclusive expression of surface antigens in Paramecium tetraurelia
Abstract
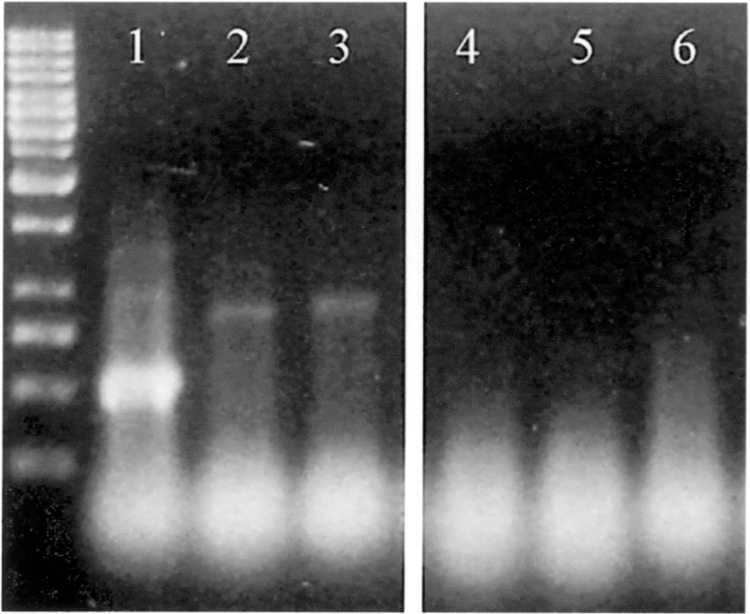
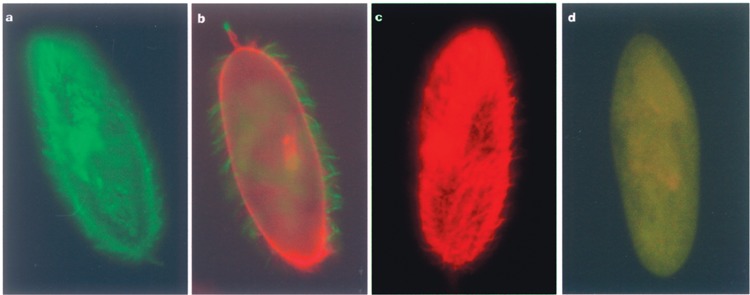
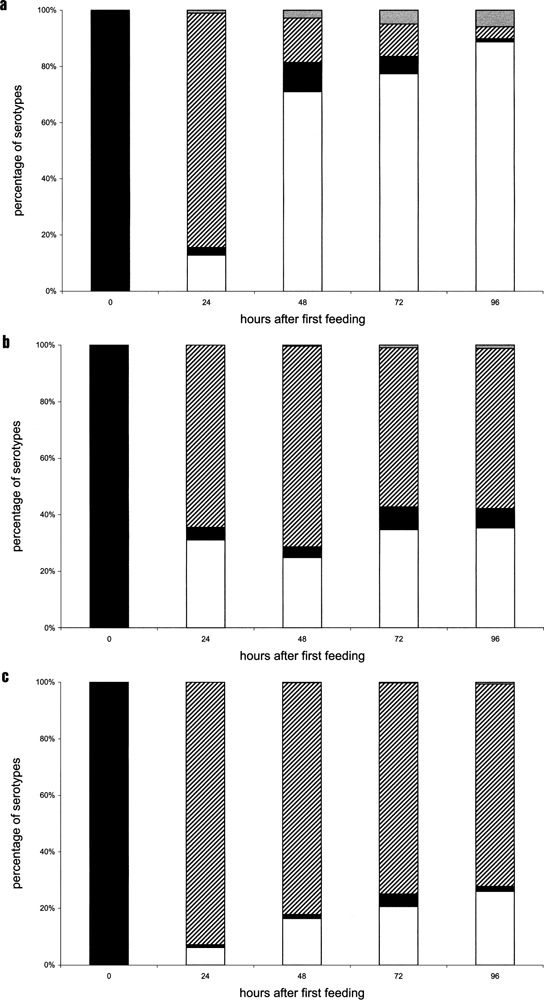
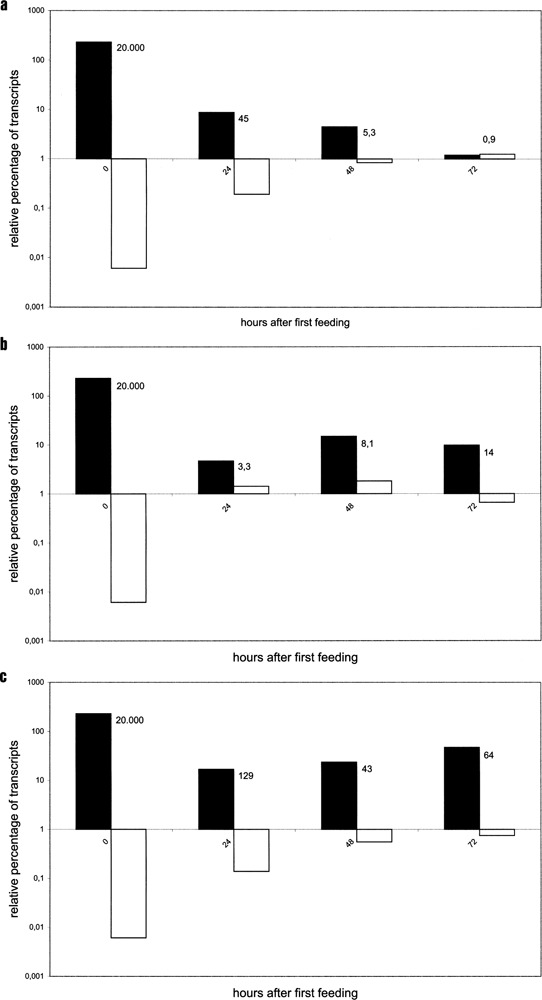
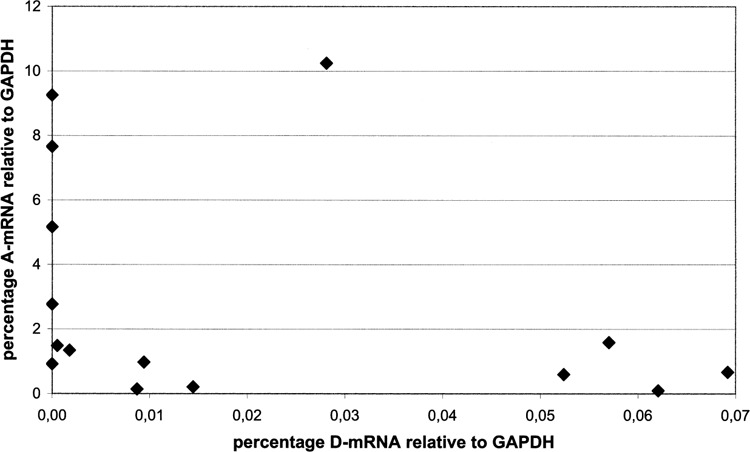
Variable antigens are large proteins located on the outer membrane of parasitic but also of free-living protists. Multigene families encoding surface antigens demonstrate an exclusive expression of proteins. The resulting presence of just one protein species on the cell surface is required for surface antigen function; therefore, the molecular mechanism of exclusive expression is of main interest. Regulation of gene expression and mechanisms establishing switching of antigens are hardly understood in any organism. Here we report on the reaction of Paramecium to the artificial knock down of surface antigen 51A expression by bacteria-mediated RNAi. This technique involves the feeding of dsRNA-producing bacteria. We analyzed different fragments of the target gene for dsRNA template regarding their specific knock down efficiency and found great differences. Treatment of Paramecia with RNAi against the 51A antigen demonstrated that although a massive amount of mRNA was present, the protein was not detected on the cell surface. Moreover, a minor abundance of 51D transcripts resulted in an exclusive presence of 51D proteins on the cell surface. This posttranscriptional regulation was confirmed by the transcript ratio (51A/51D) determined by real-time (RT) PCR of single cells. Because we were able to document unexclusive transcription also in wild-type cells our results indicate that this posttranscriptional regulation is a main factor of enabling exclusive gene expression. The comparison of serotype shifts, caused by efficient and inefficient knock down, indicates an involvement of full-length transcripts in regulation of gene expression. Thus, our study gives new insights into the mechanism of exclusive expression on the molecular level: (i) exclusive transcription does not occur, (ii) posttranscriptional regulation is a powerful factor enabling exclusive antigen expression, and (iii) surface antigen mRNA is shown to be involved in this mechanism in a regulating way.
Figures
Similar articles
-
Inefficient serotype knock down leads to stable coexistence of different surface antigens on the outer membrane in Paramecium tetraurelia.Eur J Protistol. 2006 Mar;42(1):49-53. doi: 10.1016/j.ejop.2005.09.003. Epub 2006 Feb 2. Eur J Protistol. 2006. PMID: 17070750
-
The 5' coding region of Paramecium surface antigen genes controls mutually exclusive transcription.Proc Natl Acad Sci U S A. 1996 Apr 2;93(7):2838-43. doi: 10.1073/pnas.93.7.2838. Proc Natl Acad Sci U S A. 1996. PMID: 8610128 Free PMC article.
-
Evidence for transcriptional self-regulation of variable surface antigens in Paramecium tetraurelia.Gene Expr. 1999;8(5-6):263-72. Gene Expr. 1999. PMID: 10947076
-
Antigenic variation in ciliates: antigen structure, function, expression.J Eukaryot Microbiol. 2007 Jan-Feb;54(1):1-7. doi: 10.1111/j.1550-7408.2006.00226.x. J Eukaryot Microbiol. 2007. PMID: 17300509 Review.
-
Molecular biology of the genes for immobilization antigens in Paramecium.J Protozool. 1987 Nov;34(4):418-23. doi: 10.1111/j.1550-7408.1987.tb03205.x. J Protozool. 1987. PMID: 3323480 Review.
Cited by
-
A forward genetic screen reveals essential and non-essential RNAi factors in Paramecium tetraurelia.Nucleic Acids Res. 2014 Jun;42(11):7268-80. doi: 10.1093/nar/gku223. Epub 2014 May 23. Nucleic Acids Res. 2014. PMID: 24860163 Free PMC article.
-
Distinct RNA-dependent RNA polymerases are required for RNAi triggered by double-stranded RNA versus truncated transgenes in Paramecium tetraurelia.Nucleic Acids Res. 2010 Jul;38(12):4092-107. doi: 10.1093/nar/gkq131. Epub 2010 Mar 3. Nucleic Acids Res. 2010. PMID: 20200046 Free PMC article.
-
Broad domains of histone marks in the highly compact Paramecium macronuclear genome.Genome Res. 2022 Apr;32(4):710-725. doi: 10.1101/gr.276126.121. Epub 2022 Mar 9. Genome Res. 2022. PMID: 35264449 Free PMC article.
-
Primary and secondary siRNA synthesis triggered by RNAs from food bacteria in the ciliate Paramecium tetraurelia.Nucleic Acids Res. 2015 Feb 18;43(3):1818-33. doi: 10.1093/nar/gku1331. Epub 2015 Jan 15. Nucleic Acids Res. 2015. PMID: 25593325 Free PMC article.
-
Genomic characterization of variable surface antigens reveals a telomere position effect as a prerequisite for RNA interference-mediated silencing in Paramecium tetraurelia.mBio. 2014 Nov 11;5(6):e01328. doi: 10.1128/mBio.01328-14. mBio. 2014. PMID: 25389173 Free PMC article.
References
-
- Antony C.; Capdeville Y. Uneven distribution of surface antigens during antigenic variation in Paramecium primaurelia . J. Cell Sci. 92:205–215; 1989.
-
- Capdeville Y.; Baltz T.; Deregnaucourt C.; Keller A. M. Immunological evidence of a common structure between Paramecium surface antigens and Trypanosoma variant surface glycoproteins. Exp. Cell Res. 167:75–86; 1986. - PubMed
-
- Capdeville Y.; Caron F.; Antony C.; Deregnaucourt C.; Keller A. M. Allelic antigen and merbrane anchor-epitopes of Paramecium primaurelia surface antigens. J. Cell Sci. 88:553–562; 1987.
MeSH terms
Substances
LinkOut - more resources
Full Text Sources