. 2007 Jan 1;79(1):161-7.
doi: 10.1021/ac061270o.

Simultaneous maximization of cell permeabilization and viability in single-cell electroporation using an electrolyte-filled capillary

Affiliations

Simultaneous maximization of cell permeabilization and viability in single-cell electroporation using an electrolyte-filled capillary

Aparna Agarwal et al. Anal Chem. .

Abstract

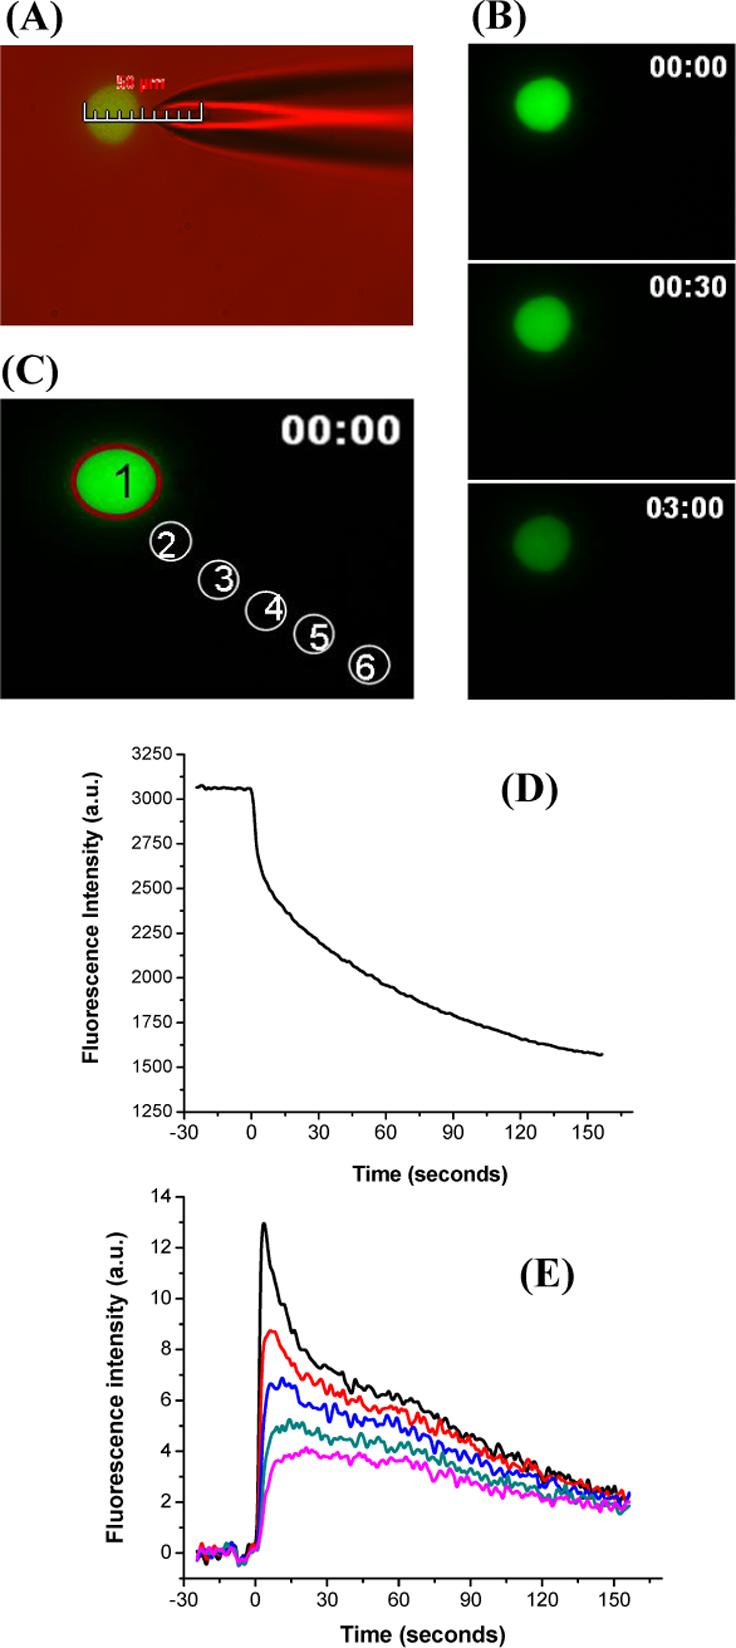
A549 cells were briefly exposed to Thioglo-1, which converts thiols to fluorescent adducts. The fluorescent cells were exposed to short (50-300 ms) electric field pulses (500 V across a 15 cm capillary) created at the tip of an electrolyte-filled capillary. Fluorescence microscopy revealed varying degrees of cell permeabilization depending on the conditions. Longer pulses and a shorter cell-capillary tip distance led to a greater decrease in the cell's fluorescence. Live/dead (calcein AM and propidium iodide) testing revealed that a certain fraction of cells died. Longer pulses and shorter cell-capillary tip distances were more deadly. An optimum condition exists at a cell-capillary tip distance of 3.5-4.5 microm and a pulse duration of 120-150 ms. At these conditions, >90% of the cells are permeabilized and 80-90% survive.


Figures

Figure 1
Figure 1
Schematic picture of the experimental setup. (A) Cultured cells were mounted in a chamber on the microscope stage. The tapered outlet end of the capillary was positioned close to a fluorescent cell with the help of a micromanipulator. The inlet end of the capillary was placed in a buffer-filled vial. The setup was connected to a high voltage power supply. (B) Single pulse of varying pulse durations (50 ms −300 ms) were applied at 500 V. This resulted in the release of fluorescent thiols from the cell interior.
Figure 2
Figure 2
Visualization of single cell electroporation. Plated cells were incubated with 2 μM Thioglo-1 in the intracellular buffer. A single pulse of 200 ms at a cell-capillary tip distance 5.0 μm was applied at 500 V. Images were collected at a frequency of one frame per second. (A) Photomicrograph produced by an overlay of fluorescence and differential interference contrast image. The image shows the placement of the capillary at a distance of 5 μm from the cell. (B) Fluorescence images before pulsation (0 s), and after pulsation (30 s and 3 min from the start of acquisition). (D) Change in average fluorescence intensity for region 1 (C) against time. (E) Change in average fluorescence intensity for regions 2−6 (C) outside the cell against time. All the data were corrected for bleaching.
Figure 3
Figure 3
High spatial resolution achieved with single cell electroporation. Plated cells were incubated with 2 μM Thioglo-1 in the intracellular buffer. A single pulse of 200 ms at a cell-capillary tip distance of 2.0 μm was applied at 500 V. Images were collected at a frequency of one frame per second. (A) Fluorescence micrograph of 2 fluorescent cells ∼ 10 μm from each other. The arrow shows the approximate position of the capillary. The images were taken before pulsation (0 s), and after pulsation (30 s, and 2 min after the start of the acquisition). (C) Normalized average fluorescence intensity for cells A and B (B) against time. All the data were corrected for bleaching.
Figure 4
Figure 4
Effect of cell-capillary tip distance and pulse duration. (A) Average fluorescence intensity (normalized) vs. time plotted for all cells electroporated with a single pulse of 200 ms and cell-capillary tip distance of 2.0 μm − 10.0 μm at 500 V. The pink, green, blue, red and black curves correspond to 10.0, 7.0, 5.0, 3.5, and 2.0 μm cell-capillary tip distances respectively. (B) Average fluorescence intensity (normalized) vs. time plotted for all cell electroporated with a single pulse of varying pulse durations (50 ms to 300 ms), and cell-capillary tip distance of 3.5 μm at 500 V. Black, red, blue, and green curves correspond to 50, 100, 200, and 300 ms pulse durations respectively. All the data were corrected for bleaching.
Figure 5
Figure 5
Determination of optimal parameters to achieve maximum cell survivability and electroporation. Contour plot of fraction of electroporated cells (solid contour lines) superimposed on contour plot of cell survivability (shaded contour). Contour plot of cell survivability percentage was plotted as a function of pulse duration and cell-capillary tip distance. Contour plots were made by Renka-Cline method of interpolation.

References

    1. Teissie J, Eynard N, Gabriel B, Rols MP. Advanced Drug Delivery Reviews. 1999;35:3–19. - PubMed
    1. Phez E, Faurie C, Golzio M, Teissie J, Rols M-P. Biochimica et Biophysica Acta, General Subjects. 2005;1724:248–254. - PubMed
    1. Teissie J, Golzio M, Rols MP. Biochimica et Biophysica Acta, General Subjects. 2005;1724:270–280. - PubMed
    1. Weaver JC, Chizmadzhev YA. Bioelectrochemistry and Bioenergetics. 1996;41:135–160.
    1. Weaver JC, Vaughan TE, Chizmadzhev Y. Advanced Drug Delivery Reviews. 1999;35:21–39. - PubMed

Publication types