. 2007 Jan;5(1):e9.
doi: 10.1371/journal.pbio.0050009.

An HIV feedback resistor: auto-regulatory circuit deactivator and noise buffer

Affiliations

An HIV feedback resistor: auto-regulatory circuit deactivator and noise buffer

Leor S Weinberger et al. PLoS Biol. 2007 Jan.

Abstract

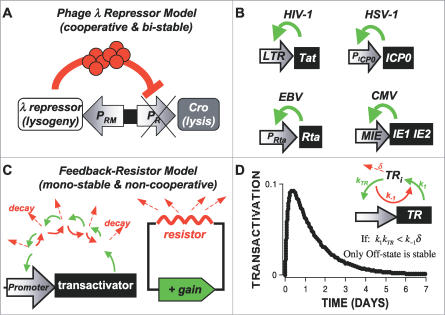
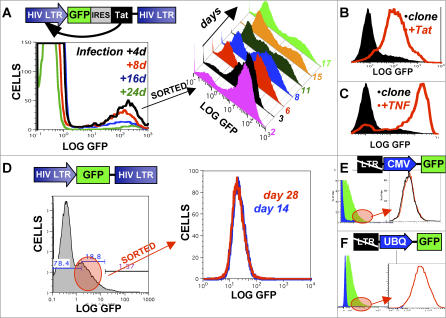
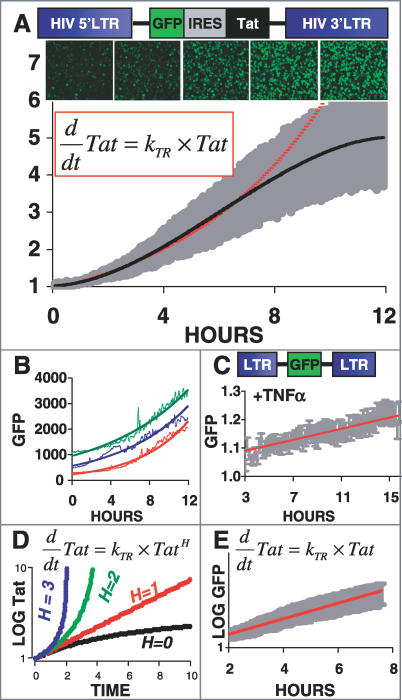
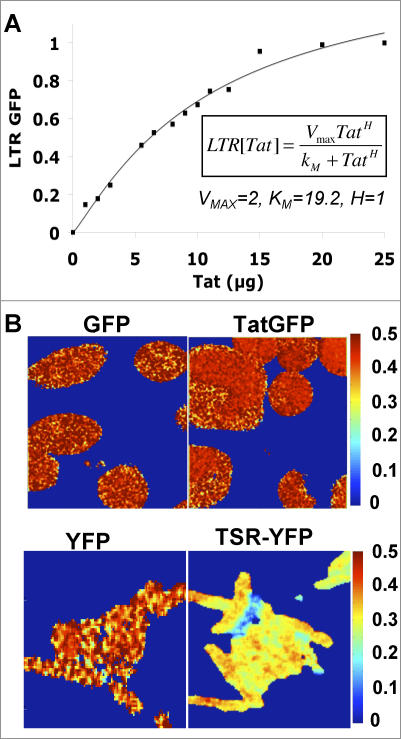
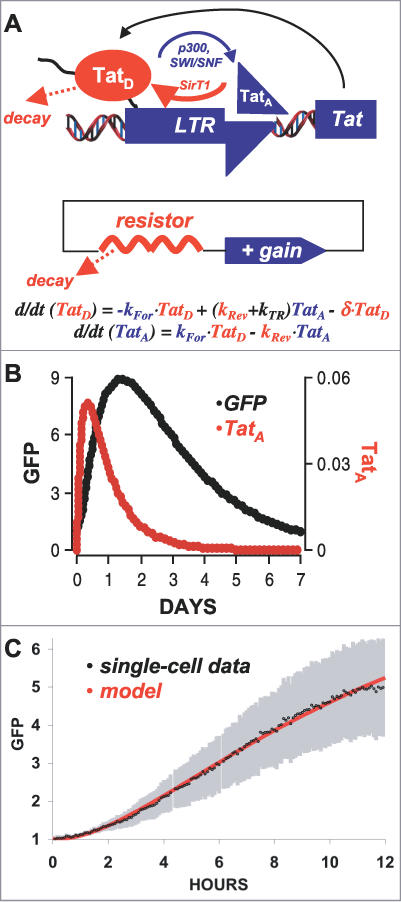
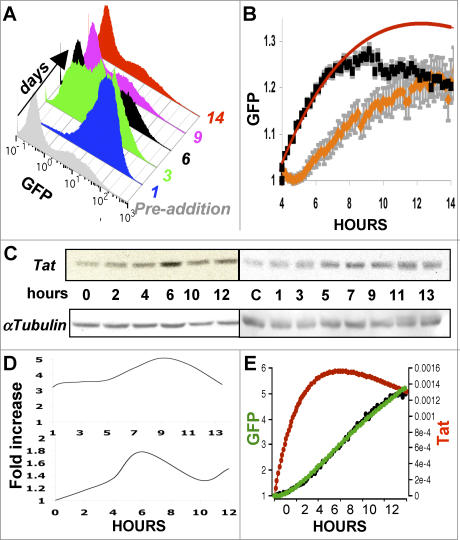
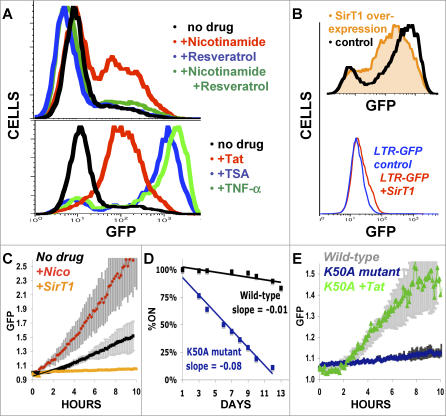
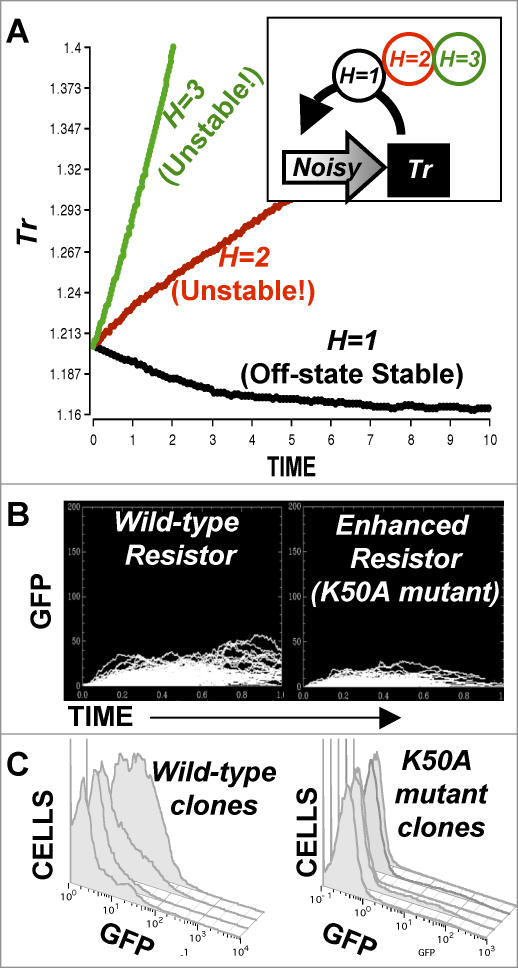
Animal viruses (e.g., lentiviruses and herpesviruses) use transcriptional positive feedback (i.e., transactivation) to regulate their gene expression. But positive-feedback circuits are inherently unstable when turned off, which presents a particular dilemma for latent viruses that lack transcriptional repressor motifs. Here we show that a dissipative feedback resistor, composed of enzymatic interconversion of the transactivator, converts transactivation circuits into excitable systems that generate transient pulses of expression, which decay to zero. We use HIV-1 as a model system and analyze single-cell expression kinetics to explore whether the HIV-1 transactivator of transcription (Tat) uses a resistor to shut off transactivation. The Tat feedback circuit was found to lack bi-stability and Tat self-cooperativity but exhibited a pulse of activity upon transactivation, all in agreement with the feedback resistor model. Guided by a mathematical model, biochemical and genetic perturbation of the suspected Tat feedback resistor altered the circuit's stability and reduced susceptibility to molecular noise, in agreement with model predictions. We propose that the feedback resistor is a necessary, but possibly not sufficient, condition for turning off noisy transactivation circuits lacking a repressor motif (e.g., HIV-1 Tat). Feedback resistors may be a paradigm for examining other auto-regulatory circuits and may inform upon how viral latency is established, maintained, and broken.


Conflict of interest statement

Competing interests. The authors have declared that no competing interests exist.

Figures

Figure 1
Figure 1. Repressor Versus Resistor: Latent Animal Virus Circuits Lack λ-Like Bi-Stable Repressor Motifs but Might Maintain Stability Using a Feedback Resistor
(A) Cartoon of the cooperative, bi-stable λ repressor model. λ DNA contains a bi-directional operator/promoter and λ repressor forms an octamer that binds to operator elements and inhibits Cro expression. Blocks represent genes and faded block arrows represent respective promoters PR and PRM. (B) Four animal viruses that lack bi-stable repressor motifs in their regulatory circuits and encode simple transactivation motifs. Blocks represent genes and faded block arrows represent promoters. (C) The feedback resistor model. Enzymatic interconversions (a futile cycle) of the transactivator to its final functional form generate nontransactivating intermediates and make up a dissipative (or nonadiabatic) resistor in an excitatory feedback circuit. Green arrows are forward modifications, red arrows are a reversal of the modification, and dashed red arrows are decay (turnover). (D) The feedback resistor generates a pulse of transactivation. For simplicity, we present a numerical simulation of the feedback resistor model for a transactivor (Tr) having a single intermediate (Tr i ): dTr/dt = − k 1 Tr + (k −1 + k TR)Tr i − δTr; dTr i/dt = k 1 Trk −1 Tr i when k 1 k TR < k −1δ (i.e., all eigenvalues are negative) and initial condition Tr(t = 0) > 0. If the product of the backward reaction rates (i.e., negative reaction rates k −1 and δ) exceeds the forward modification rates (i.e., positive reaction rates k 1 and k TR), then a small amount of transactivator at time t = 0 generates a burst of transactivation that eventually decays over time to the only stable state: the off state (Tr,Tr 1 ) = (0,0). Under these conditions, this stable off state is attracting (mathematically, all eigenvalues are real and negative, because the Jacobian for this system has negative trace and positive determinant). In general, increasing the number of dissipative intermediate states (Tri) reduces the duration of the pulse, whereas increasing the number of nondissipative intermediate states generates a gamma-distributed delay and lengthens the duration of the pulse.
Figure 2
Figure 2. The HIV-1 Tat Circuit Is Not Bi-Stable
(A–C) Jurkat cells infected with an LTR-GFP-IRES-Tat virus (at a multiplicity of infection MOI ≈ 0.1) and analyzed by flow cytometry as the GFP+ population relaxed to the off state (left panel). GFP+ cells were also isolated by FACS, placed in culture, and analyzed by flow cytometry for residual GFP expression after various time periods (right panel). FACS indicates that the GFP+ cells relaxed into an off state over time. (GFP+ population relaxation was also observed for single-cell clonal FACS). Off state GFP cells (black) could be reactivated by incubation in either exogenous Tat protein (red) (B) or TNF-α (red) (C). Exogenous Tat protein does not overactivate the transactivated subpopulation (i.e. the transactviated mean is not brighter than in the original LTR-GFP-IRES-Tat infected cells), whereas TNF-α does overactivate the transactivated subpopulation (i.e., the transactviated mean is significantly brighter than in original LTR-GFP-IRES-Tat infected cells). (D–F) Jurkat cells infected with a control virus lacking Tat and having GFP expressed from either the HIV LTR (D), CMV major immediate early promoter (E), or the ubiquitin (UBQ) promoter (F). These infected cells were sorted via FACS to isolate GFP+ cells (left panels) and analyzed by flow cytometery after 14 days (blue) or after 28 days (red) in culture. GFP+ cells did not relax to an off state in these controls.
Figure 3
Figure 3. Single-Cell Tat Transactivation Kinetics Are Noncooperative
(A) Single-cell kinetics of LTR-GFP-IRES-Tat Jurkat cells after activation with TNF-α. Fluorescence intensities for 35 single cells over time were normalized (gray). At times <8 h, the average intensity fit the noncooperative minimal feedback model: d/dt(Tat) = k×Tat or its exponential solution Tat(t) = Tat0×expkt (red line). A quadratic expression (also noncooperative) provides an equally good data fit at early times, and it is difficult to distinguish between exponential and quadratic (unpublished data). At later times after TNF-α treatment, GFP fluorescence plateaus, possibly due to the intrinsic dynamics of the NF-κB response [70], but transactivation kinetics still fit the noncooperative saturating feedback model: dTat/dt = (k TR × Tat)/(k M + Tat) − δ × Tat with k TR ≈ 8, k M ≈ 0.08, and δ ≈ 2 as determined by nonlinear least-squares regression. Since the minimal model d/dt(Tat) = kM × Tat fits the data essentially perfectly for the first 8 h, indicating that Michaelis-Menten saturation is unnecessary for fitting shot-term <8-h data, for simplicity we focus on the minimal model and <8-h data. (B) Representative non-normalized, single-cell data used to construct panel (A). (C) Control: LTR-GFP kinetics after TNF-α activation are linear in time, indicating that the exponential (or quadratic) Tat activation kinetics cannot be explained by an intrinsic property of TNF-α activation. (D) Log scale plots of the solution to d/dt(Tat) = kTR×TatH for increasing values of cooperativity (i.e., the Hill coefficient, H). Both the cases where H = 0 and H = 1 are noncooperative, and the H = 1 case is linear on a log scale. (E) LTR-GFP-IRES-Tat transactivation kinetics [from (A)]) replotted on a log scale, showing that Tat transactivation kinetics more closely match a noncooperative system (i.e., H ≈ 1).
Figure 4
Figure 4. Tat Functions in a Noncooperative Manner
(A) An LTR-GFP clone was exposed to varying amounts of purified Tat protein and analyzed by flow cytometry 12 h later. Data were fit by nonlinear least-squares regression to a Michaelis-Menten model (inset) allowing the cooperative Hill coefficient to vary. The Hill coefficient was robustly measured to be 1 under all initializations tested. (B) Polarization anisotropy (homo-FRET) analysis of Tat-GFP in single Jurkat cells infected with either LTR-GFP or LTR-IRES-TatGFP virus. A TSR-YFP fusion protein known to multimerize and exhibit homo-FRET exchange [69] was used as a positive control. Polarization anisotropy r values are shown in color with color bar at right. Cells expressing either (monomeric) GFP or YFP displayed polarization values of r ≈ 0.47 near the theoretical two-photon limit of r = 0.5 (red). Cells expressing TSR-YFP displayed significantly reduced polarization r values (r ≈ 0.3, yellow), indicating homo-FRET exchange. Cells expressing Tat-GFP displayed a slight increase in polarization anisotropy (r ≈ 0.5), indicating that no homo-FRET was occurring.
Figure 5
Figure 5. The Feedback Resistor Model
(A) A simplified schematic of the feedback resistor model for HIV-1 Tat transactivation along with the analogous circuit diagram and color-coded differential equations describing the system. Deacetylated Tat protein (Tat D, red oval) is in excess in the cell and, along with CDK9 and CyclinT1 (not shown), binds the TAR RNA loop (black line) at the HIV-1 LTR and is acetylated by p300 (blue arrow). Acetylated Tat protein (Tat A, blue triangle) is the limiting reagent, which completes the transactivation loop by recruiting SWI/SNF. However, SirT1 deacetylation (red arrow) can back-convert Tat A to Tat D, and SirT1 deacetylation of Tat A is significantly faster than p300 acetylation of Tat D. To account for intrinsic dynamics of the NF-κB response and NF-κB p50-HDAC effects on local chromatin environment, a time-varying basal expression parameter (k basal) can be included in the TatD equation, but this was unnecessary did not qualitatively alter the behavior of the model. (B) Numerical simulations of Equations 1 and 2 plus an added reporter equation, which has standard Michaelis-Menten promoter saturation, for tracking GFP expression. d/dt(GFP) = IRES·k TR ·Tat A /(k M + Tat A ) − δGFP ·GFP. Simulations show that the feedback resistor model produces a stable off state and generates a pulse of transactivation over several days [GFP shown in black, Tat A shown in red; parameters used: k for = 0.5/d, k rev = 5/d, k TR = 5/d, δTat = 2/d, δGFP = 0.5/d, IRES = 50, k M = Tat D (0)= 0.001, GFP(0) = 1]. (C) Nonlinear least-squares regression of the model to the single-cell kinetic data from Figure 3A. The initial rise in the pulse of GFP expression (red line) predicted by the simulation in (B) matches the single-cell data from Figure 3A (black circles are the mean). Incorporating Michaelis-Menten saturation effects into other processes/parameters in the model did not qualitatively change the model behavior or the fit (unpublished data).
Figure 6
Figure 6. Direct Visualization of the Feedback Pulse
(A) An LTR-GFP-IRES-Tat Jurkat clone was incubated in medium containing exogenous Tat protein for 4 h, and then GFP expression was followed by flow cytometry for 2 wk. Transactivated cells eventually relaxed back into the off state. In a simple positive-feedback circuit, transactivated cells would be predicted to remain GFP+. (B) Pooled single-cell trajectories (average of ∼100 cells) of an LTR-GFP Jurkat clone incubated in exogenous Tat protein for 4 h and then imaged (black squares) for 10 h. The downward trajectory of the GFP pulse begins at 9 h after addition of exogenous Tat, far quicker than predicted in a non–feedback resistor simulation based on a Tat half-life of 8 h (red line). The transactivation decay was based on Tat half-life alone (red line). Performing the same exogenous Tat incubation with cells in which SirT1 is overexpressed from a retrovirus vector decreases the upward slope of the pulse (orange). Error bars are shown as gray background behind the data points. (C) Western blot analysis of Tat transactivation kinetics in LTR-GFP-IRES-Tat cells after exposure to TNF-α. Analyses were split into even and odd time points. The Tat signal band was visible at ∼15 kDa, whereas the control α-tubulin signal was visible at ∼50 kDa. The Tat protein level shows a pulse, peaking at 6–8 h after TNF-α exposure, despite constant α-tubulin levels. (D) Quantitative densitometry analysis of the Western blots in (C). Tat data was normalized by subtraction of α-tubulin data for corresponding time points and plotted as fold increase relative to the first time point. (E) A replotting of regression fit from Figure 5C but with the simulation for Tat included, showing that the model predicts both an exponential/quadratic increase in GFP and a pulse of TatA with a peak at 6–8 h.
Figure 7
Figure 7. Perturbation of the Feedback Resistor and Off State Stability
(A) SirT1 inhibitors diminish the feedback resistor and destabilize the off state, but the effects are mitigated by co-incubation with the SirT1 activator resveratrol, which restabilizes the off state. An LTR-GFP-IRES-Tat Jurkat clone (E7) was exposed to either no drug (upper panel, black), nicotimamide (upper panel, red), resveratrol (upper panel, blue), or the combination of nicotinamide plus resveratrol (upper panel, green) for 72 h, and GFP expression was quantified by FACS. Off state destabilization via SirT1 inhibition is comparable to activation by exogenous Tat protein (lower panel, red), which does not enhance transcriptional initiation or alter local chromatin state. However, SirT1 inhibition is not comparable to activation by TSA (lower panel, blue) or TNF-α (lower panel, green), which do enhance transcriptional initiation by altering local chromatin state, and result in significantly increased activation. (B) SirT1 overexpression amplifies the feedback resistor and stabilizes the off state. Upper panel: a Jurkat clone (LTR-GFP-IRES-Tat) was infected with a neomycin-resistant retrovirus expressing either SirT1 (orange) or an E. coli coding region as a control (black). After selection of neomycin-resistant cells, GFP expression was monitored by FACS. Lower panel: same as upper panel except that an LTR-GFP Jurkat clone was infected with the SirT1 (red) or control (blue) overexpression vectors. (C) Single-cell transactivation kinetics show that SirT1 inhibitors increase the rate of Tat-mediated activation. An LTR-GFP-IRES-Tat Jurkat clone was exposed to TNF-α (black), or TNF-α plus nicotinamide (red) and a subset of cells exhibited significantly faster transactivation kinetics in presence of nicotinamide. SirT1-overexpressing LTR-GFP-IRES-Tat cells were also exposed to TNF-α (orange). Trajectories shown are averages of ∼300 cells, gray backgrounds represent error bars. (D) A Jurkat clone expressing mutant Tat (LTR-GFP-IRES-Tat[K50A]) decays into the off state approximately 7-fold more quickly than a clone expressing wild-type LTR-GFP-IRES-Tat cells. (E) Tat acetylation mutant LTR-GFP-IRES-Tat(K50A) has approximately 6-fold slower transactivation kinetics (black) as compared to LTR-GFP-IRES-Tat (gray), and exogenous Tat (green) can rescue the mutant producing wild-type transactivation kinetics.
Figure 8
Figure 8. The Feedback Resistor is Relatively Robust to Molecular Noise
(A) Numerical simulations of the ODE: dTr/dt = KTR × Tr H/(k M + Tr H) − δ × Tr + NOISE(X), with a hypothetical transactivator (Tr) and increasing levels of cooperativity (H): Tr requires either monomers (H = 1), dimers (H = 2), or trimers (H = 3) to complete transactivation. The cooperative-feedback model (i.e., H > 1) is more sensitive to noise than the H = 1 noncooperative feedback model (the feedback resistor is a noncooperative feedback model). All parameters (except H) were kept constant for all simulations: k TR = 1.6, k m = 10, δ = 0.5, NOISE(X) is a random number generated from a uniform distribution X = [0,1.6], and initial condition Tr 0 =NOISE(0,2). Only H was varied between the simulations: H = 1, 2, or 3. Similar results were also obtained with a simpler nonsaturating feedback ODE model (unpublished data). (B) Simulation of a stochastic version of the feedback resistor model diagrammed in Figure 5A. Trajectories are direct Monte-Carlo simulations of the chemical master equation for Equation 1 and 2. Simulations predict that HIV-1 Tat levels continually fluctuate above the off state and that computationally strengthening the feedback resistor (by reducing the value of k for by 2-fold) decreases the level of the fluctuations above the off state. (C) To test this prediction experimentally, single cells in the off state (GFP) were sorted with FACS from LTR-GFP-IRES-Tat and LTR-GFP-IRES-Tat(K50A) clones, grown for approximately 3 wk, and then analyzed by FACS for GFP expression. Off state fluctuations in the mutant clone were highly diminished compared to wild type, as predicted by the simulations. Four representative clones of cells containing wild-type and mutant Tat are shown from a total of 12 that were analyzed.

Comment in

Similar articles

Cited by

References

    1. Samoilov M, Plyasunov S, Arkin AP. Stochastic amplification and signaling in enzymatic futile cycles through noise-induced bistability with oscillations. Proc Natl Acad Sci U S A. 2005;102:2310–2315. - PMC - PubMed
    1. Ptashne M. A genetic switch: Phage lambda revisited. Cold Spring Harbor (NewYork): Cold Spring Harbor Laboratory Press; 2004. 154
    1. Dodd IB, Perkins AJ, Tsemitsidis D, Egan JB. Octamerization of lambda CI repressor is needed for effective repression of P(RM) and efficient switching from lysogeny. Genes Dev. 2001;15:3013–3022. - PMC - PubMed
    1. Hasty J, Pradines J, Dolnik M, Collins JJ. Noise-based switches and amplifiers for gene expression. Proc Natl Acad Sci U S A. 2000;97:2075–2080. - PMC - PubMed
    1. Brandman O, Ferrell JE, Jr., Li R, Meyer T. Interlinked fast and slow positive feedback loops drive reliable cell decisions. Science. 2005;310:496–498. - PMC - PubMed

Publication types

MeSH terms

Substances