. 2006 Dec 22;2(12):e169.
doi: 10.1371/journal.pcbi.0020169. Epub 2006 Oct 30.

Connectivity in the yeast cell cycle transcription network: inferences from neural networks

Affiliations

Connectivity in the yeast cell cycle transcription network: inferences from neural networks

Christopher E Hart et al. PLoS Comput Biol. .

Abstract

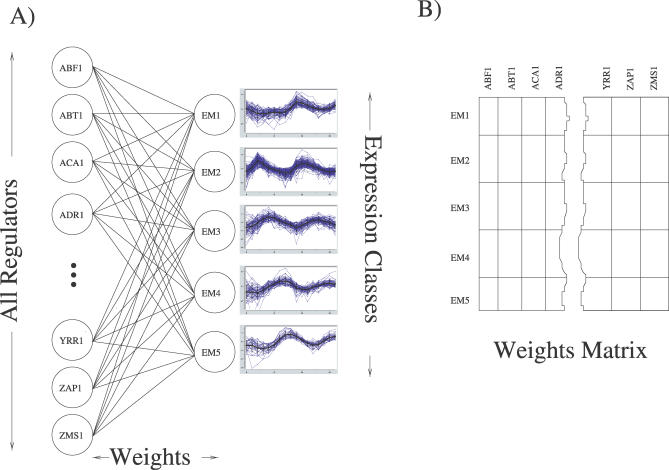
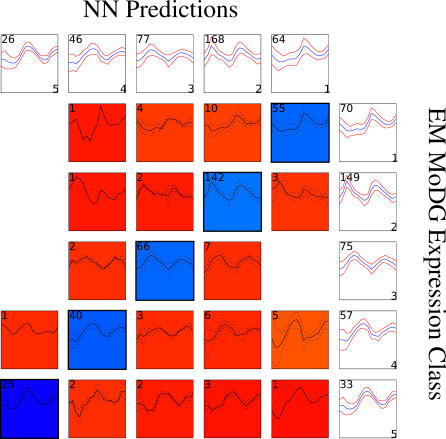
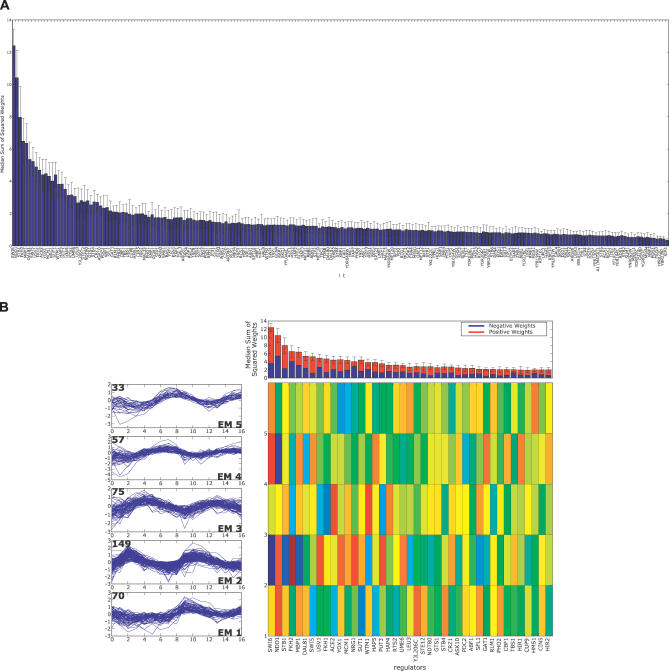
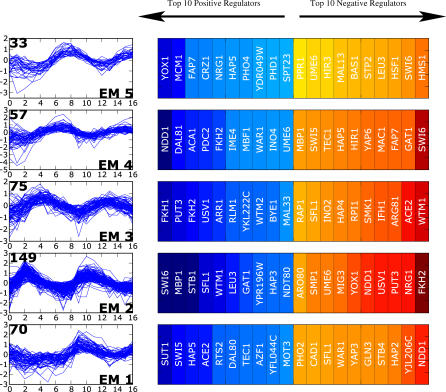
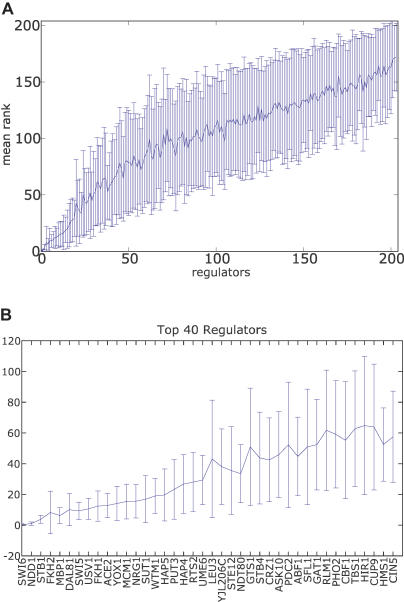
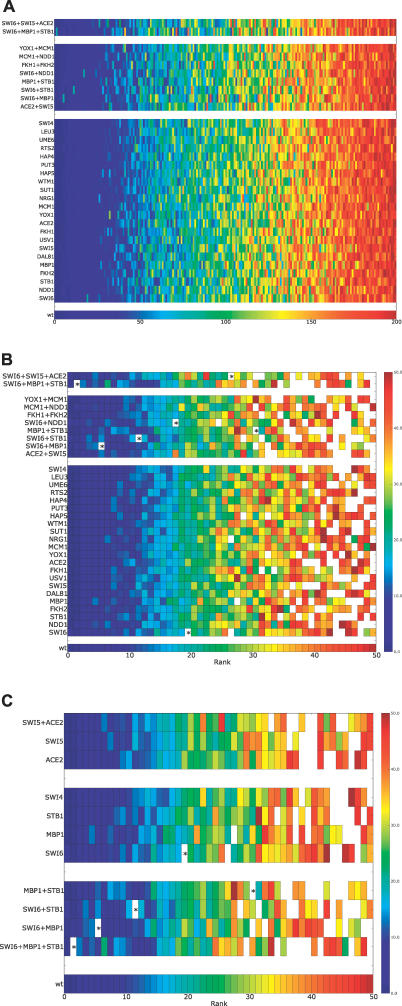
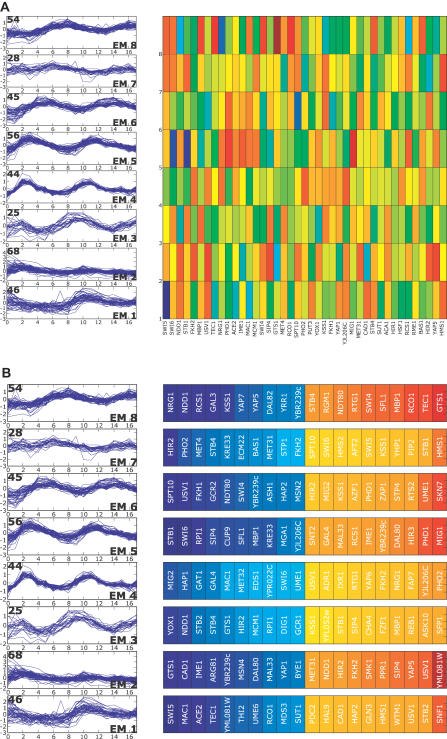
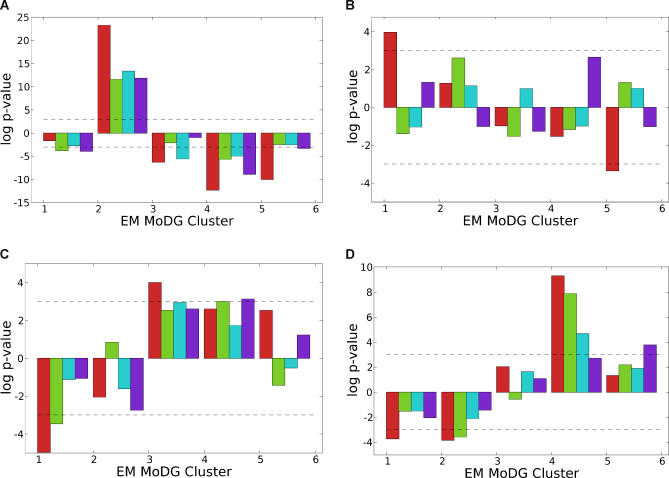
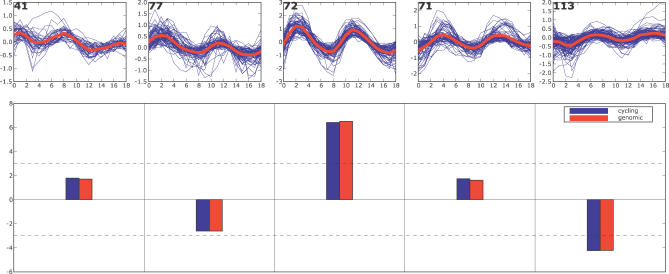
A current challenge is to develop computational approaches to infer gene network regulatory relationships based on multiple types of large-scale functional genomic data. We find that single-layer feed-forward artificial neural network (ANN) models can effectively discover gene network structure by integrating global in vivo protein:DNA interaction data (ChIP/Array) with genome-wide microarray RNA data. We test this on the yeast cell cycle transcription network, which is composed of several hundred genes with phase-specific RNA outputs. These ANNs were robust to noise in data and to a variety of perturbations. They reliably identified and ranked 10 of 12 known major cell cycle factors at the top of a set of 204, based on a sum-of-squared weights metric. Comparative analysis of motif occurrences among multiple yeast species independently confirmed relationships inferred from ANN weights analysis. ANN models can capitalize on properties of biological gene networks that other kinds of models do not. ANNs naturally take advantage of patterns of absence, as well as presence, of factor binding associated with specific expression output; they are easily subjected to in silico "mutation" to uncover biological redundancies; and they can use the full range of factor binding values. A prominent feature of cell cycle ANNs suggested an analogous property might exist in the biological network. This postulated that "network-local discrimination" occurs when regulatory connections (here between MBF and target genes) are explicitly disfavored in one network module (G2), relative to others and to the class of genes outside the mitotic network. If correct, this predicts that MBF motifs will be significantly depleted from the discriminated class and that the discrimination will persist through evolution. Analysis of distantly related Schizosaccharomyces pombe confirmed this, suggesting that network-local discrimination is real and complements well-known enrichment of MBF sites in G1 class genes.


Conflict of interest statement

Competing interests. The authors have declared that no competing interests exist.

Figures

Figure 1
Figure 1. The Artificial Neural Network Architecture
(A) Shown is the simple single layer network we trained to predict expression behavior based on the in vivo binding activity of ∼75% of the transcription regulators in yeast. A 204-dimension vector containing the measured transcription factor binding data from [21] was used as the input vector. Given this binding vector, the ANN was trained to predict which of the five cell cycle expression classes (clusters) each gene belongs to. These expression classes were determined using EM MoDG. (B) Matrix representation of the ANN. Each matrix cell, Wc,r, represents the real-valued connection strength, or weight, between a regulator (r) and an expression class (c) and is shown in (A) as an edge between a regulator and an expression class. These weights represent the importance of binding activity or inactivity for each transcription factor in associating a member gene with its expression class (cluster) under the ANN model.
Figure 2
Figure 2. Confusion Array Display for the aobANN versus Membership in EM MoDG Expression Class
Expression class predictions from the aobANN (based on ChIPchip factor binding data) are displayed in a confusion array against the starting expression classes from EMDoG clustering. Each of the 40 contributing “best” ANNs were trained on 80% of the data and tested on the remaining 20% to evaluate performance. They were selected as the best performing network out ten networks trained on the same data split, but initialized with differing random seeds. These two classifications have a similarity of .86 by linear assignment [9]: an LA value of 1.0 would indicate perfect classification success by the ANNs.
Figure 3
Figure 3. Weight Matrix Analysis for the aobANN
(A) Regulators were sorted based on the SOS metric (Methods and text), and the resulting total SOS rank for each regulator is plotted as a bar. (B) The top 20 regulators are shown, ordered by importance in predicting expression behavior using the sum-of-squared weights metric. The top panel reproduces a zoomed-in view of the top 20 regulators as in (A). The bar representing each regulator is split to display positive (red) and negative (blue) contributions. The left-hand column shows a trajectory summary for each expression cluster as classified by EM MoDG. The right-hand side color map represents the weight matrix where expression classes are displayed along the rows corresponding to the drawn trajectory summaries. Regulators are sorted along the columns in rank order. Each cell is colored according to its value in the weights matrix.
Figure 4
Figure 4. ANN Weights Sorted According to Expression Class
ANN weights from the aob network for the top-ranking and bottom-ranking (high negative weights) for each class. The regulator ranking for each class is determined by its value in the aobANN weights matrix for each expression class. Detailed annotations for these regulators are given in Table 1.
Figure 5
Figure 5. Neural Network Rank Order Stability
(A) Regulators are sorted by their SOS rank order (see text and Methods). The line indicates the mean rank for each regulator across each of 40 best ANNs, with variance of each ranking indicated by the error bar. (B) Top 20 regulators show high stability across ANNs.
Figure 6
Figure 6. In Silico Network Mutations
Shown are results from training ANNs missing one or more regulators as indicated on the left margin of each heatmap. Within each heatmap, each cell represents a regulator, the position of the cell along the x-axis of the plot is determined by the mutated network, but the color is indicative of the regulator's rank in the unperturbed network (as shown in Figure 3). The lowest strip shows the rank order color spectrum for the wild-type network. (A) An overview showing the overall rank stability of the regulators across all mutant networks generated. (B) A higher resolution view of the top-ranked regulators for each mutant network. Only the top 50 regulators are shown, and the color spectrum is adjusted to only span 1–50. Any regulator that was ranked within the top 50 regulators in a mutant network, but not in the wild-type network, is shown as white. The position of Swi4 in each network is denoted by *. (C) A zoomed-in version of our mutant network analysis focusing only on networks generated by the top G1 regulators (Swi6, Mbp1, Stb1, Ace2, Swi5, Swi4).
Figure 7
Figure 7. Overlap of Cell Cycle Groups
Venn Diagram for the total number of genes cycling in each of the three synchronization methods after our filtering and normalization.
Figure 8
Figure 8. Transcription Factor Rankings by aobANN Weights for Cdc15 Syncrhonized Data
(A) ANN weights are sorted by the SOS metric as in Figure 3B. (B) ANN weights from the aob network as in Figure 4 for ANNs trained to predict RNA expression clusters derived from yeast cultures synchronized using Cdc15 TS mutant [1].
Figure 9
Figure 9. Transcription Factor Rankings by aobANN Weights for Alpha Factor Arrest Data
(A) ANN weights are sorted by the SOS metric described in the text and in Figure 3B. (B) ANN weights from the aobANN network, as in Figure 4, for ANNs trained to predict RNA expression clusters derived from yeast cultures synchronized using alpha factor arrest to syncrhonize cells [1].
Figure 10
Figure 10. Enrichment and Depletion of Binding Sites in Individual Cell Cycle Phase Classes for Transcription Factors Highly Ranked in aobANNs in Budding Yeast Genomes
For several regulators highlighted by strong positive or negative association with particular expression classes in Figure 4 (denoted parenthetically), site enrichment p-values were calculated for each EM MoDG expression cluster. Each p-value was calculated using only the cell cycle identified genes that were also used as input genes to the ANN. Each block of bars along the x-axis represent log p-values (y-axis) for an EM MoDG cluster. Each bar within these blocks represents the log p-value measurements for a different Saccharomyces species as indicated by the color legend. Enrichment is shown as positive values (−log p-value), and depletion is shown as negative values (log p-value). The species have been arranged by to reflect evolutionary distance from S. cerevisiae. From left to right: S. cerevisiae, S. paradoxus, S. mikatae, S. bayanus. A dashed line along the graphs at p-value = .05 has been drawn to help visualize the scale difference between the plots. (A–D) Enrichment bar charts for the specified binding sites. If the binding site is referred to by a standard name other than that of the regulator that binds to it, the regulator name is in parentheses. The color map key for each specie is at the bottom.
Figure 11
Figure 11. Binding Site Enrichment and Depletion for S. Pombe
MCB consensus binding site enrichment p-values are shown for S. pombe, based an EM MoDG clustering of expression data from ([3]. Cluster trajectory summaries as a function of timepoint in the cell cycle are shown for each expression cluster in the top panels; red lines highlight the mean expression trajectory, and cluster gene number is given in the upper left corner. Below is a bar chart of p-values. p-Values are normalized against only cycling genes (blue), or are normalized against all genes (red).

Similar articles

Cited by

References

    1. Spellman PT, Sherlock G, Zhang MQ, Iyer VR, Anders K, et al. Comprehensive identification of cell cycle-regulated genes of the yeast Saccharomyces cerevisiae by microarray hybridization. Mol Biol Cell. 1998;9:3273–3297. - PMC - PubMed
    1. Cho RJ, Campbell MJ, Winzeler EA, Steinmetz L, Conway A, et al. A genome-wide transcriptional analysis of the mitotic cell cycle. Mol Cell. 1998;2:65–73. - PubMed
    1. Rustici G, Mata J, Kivinen K, Lio P, Penkett CJ, et al. Periodic gene expression program of the fission yeast cell cycle. Nat Genet. 2004;8:809–817. - PubMed
    1. Peng X, Karuturi RK, Miller LD, Lin K, Jia Y, et al. Identification of cell cycle-regulated genes in fission yeast. Mol Biol Cell. 2005;16:1026–1042. - PMC - PubMed
    1. Oliva A, Rosebrock A, Ferrezuelo F, Pyne S, Chen H, et al. The cell cycle-regulated genes of Schizosaccharomyces pombe . PLoS Biol. 2005;3(7):e225. - PMC - PubMed

MeSH terms

Substances