

A study of collective atomic fluctuations and cooperativity in the U1A-RNA complex based on molecular dynamics simulations
- PMID: 17194603
- PMCID: PMC1994251
- DOI: 10.1016/j.jsb.2006.10.022
A study of collective atomic fluctuations and cooperativity in the U1A-RNA complex based on molecular dynamics simulations
Abstract
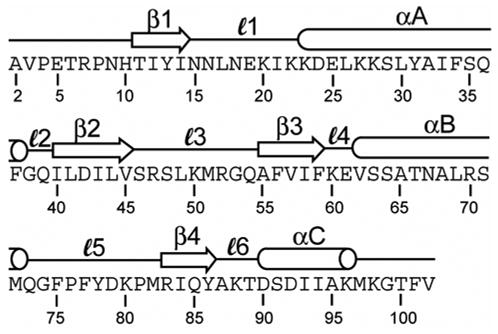
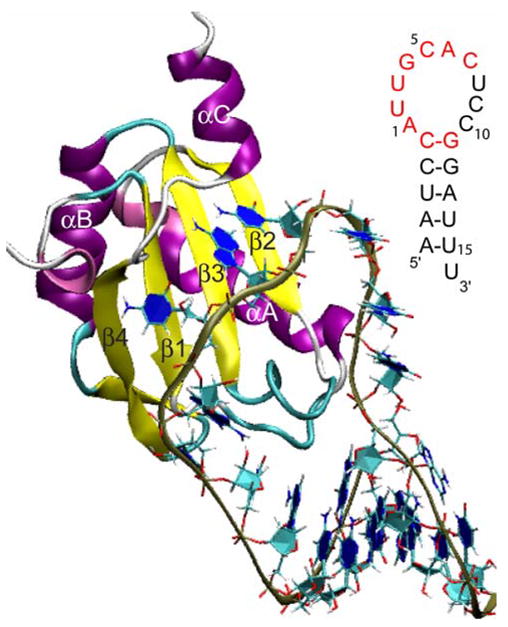
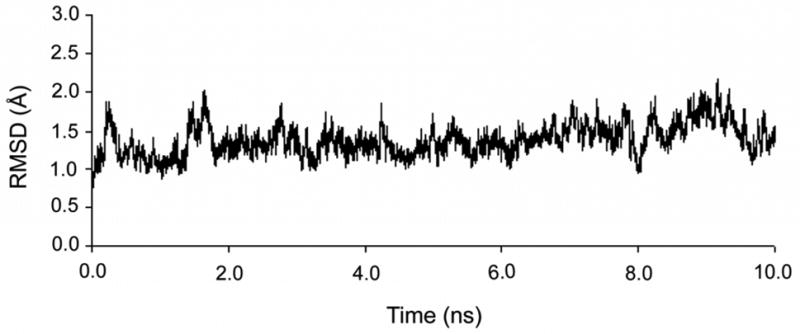
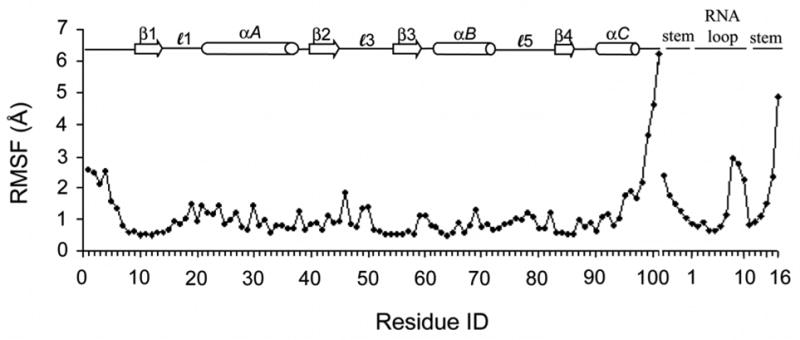
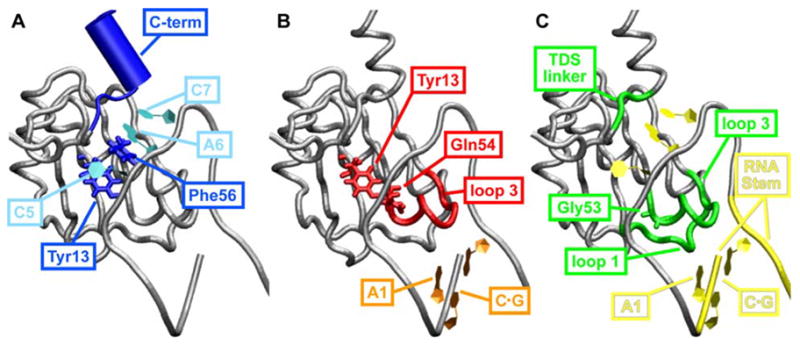
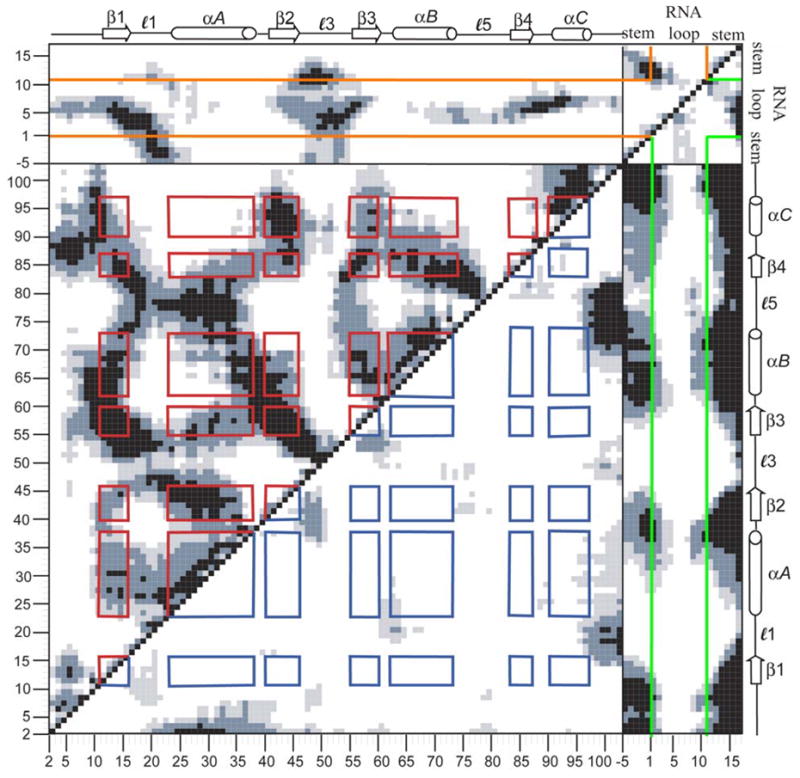
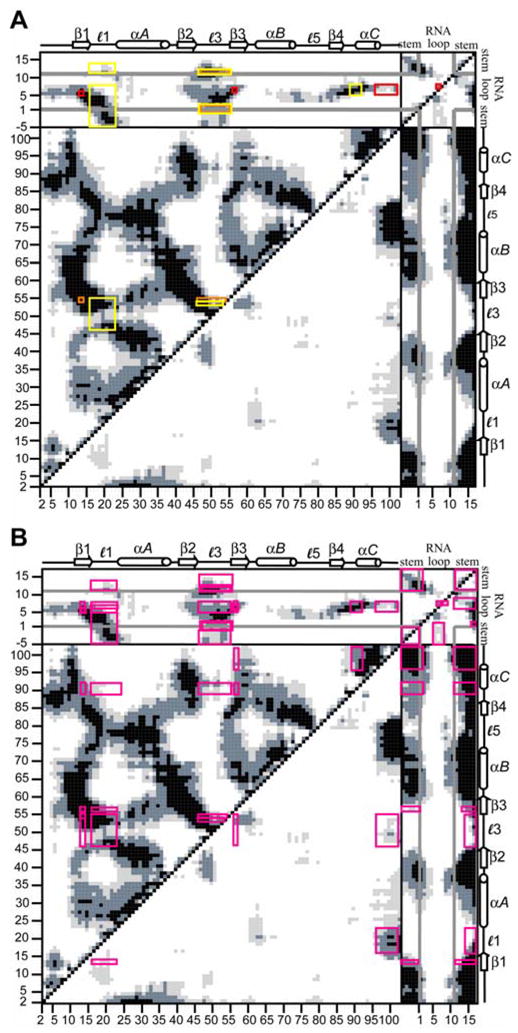
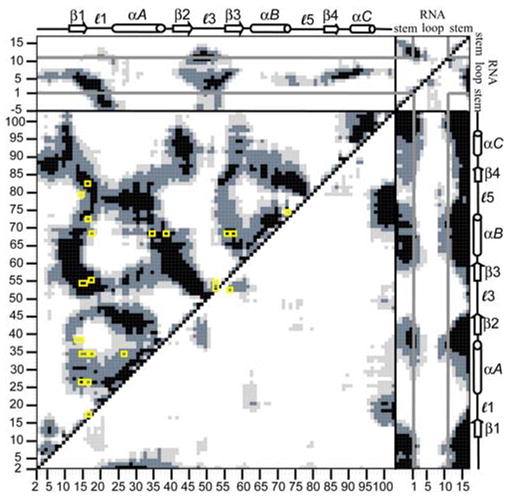
Cooperative interactions play an important role in recognition and binding in macromolecular systems. In this study, we find that cross-correlated atomic fluctuations can be used to identify cooperative networks in a protein-RNA system. The dynamics of the RRM-containing protein U1A-stem loop 2 RNA complex have been calculated theoretically from a 10 ns molecular dynamics (MD) simulation. The simulation was analyzed by calculating the covariance matrix of all atomic fluctuations. These matrix elements are then presented in the form of a two-dimensional grid, which displays fluctuations on a per residue basis. The results indicate the presence of strong, selective cross-correlated fluctuations throughout the RRM in U1A-RNA. The atomic fluctuations correspond well with previous biophysical studies in which a multiplicity of cooperative networks have been reported and indicate that the various networks identified in separate individual experiments are fluctuationally correlated into a hyper-network encompassing most of the RRM. The calculated results also correspond well with independent results from a statistical covariance analysis of 330 aligned RRM sequences. This method has significant implications as a predictive tool regarding cooperativity in the protein-nucleic acid recognition process.
Figures
Similar articles
-
Do collective atomic fluctuations account for cooperative effects? Molecular dynamics studies of the U1A-RNA complex.J Am Chem Soc. 2006 Jul 19;128(28):8992-3. doi: 10.1021/ja0606071. J Am Chem Soc. 2006. PMID: 16834346 Free PMC article.
-
Molecular dynamics simulations of the complex between human U1A protein and hairpin II of U1 small nuclear RNA and of free RNA in solution.Biophys J. 1999 Sep;77(3):1284-305. doi: 10.1016/S0006-3495(99)76979-1. Biophys J. 1999. PMID: 10465742 Free PMC article.
-
Investigation of a conserved stacking interaction in target site recognition by the U1A protein.Nucleic Acids Res. 2002 Jan 15;30(2):550-8. doi: 10.1093/nar/30.2.550. Nucleic Acids Res. 2002. PMID: 11788718 Free PMC article.
-
The role of RNA structure in the interaction of U1A protein with U1 hairpin II RNA.RNA. 2006 Jul;12(7):1168-78. doi: 10.1261/rna.75206. Epub 2006 May 31. RNA. 2006. PMID: 16738410 Free PMC article.
-
Nuclear magnetic resonance methods to study structure and dynamics of RNA-protein complexes.Methods Enzymol. 2001;339:357-76. doi: 10.1016/s0076-6879(01)39322-9. Methods Enzymol. 2001. PMID: 11462821 Review. No abstract available.
Cited by
-
Mechanisms of intramolecular communication in a hyperthermophilic acylaminoacyl peptidase: a molecular dynamics investigation.PLoS One. 2012;7(4):e35686. doi: 10.1371/journal.pone.0035686. Epub 2012 Apr 27. PLoS One. 2012. PMID: 22558199 Free PMC article.
-
A study of communication pathways in methionyl- tRNA synthetase by molecular dynamics simulations and structure network analysis.Proc Natl Acad Sci U S A. 2007 Oct 2;104(40):15711-6. doi: 10.1073/pnas.0704459104. Epub 2007 Sep 26. Proc Natl Acad Sci U S A. 2007. PMID: 17898174 Free PMC article.
-
Induced fit or conformational selection for RNA/U1A folding.RNA. 2010 May;16(5):1053-61. doi: 10.1261/rna.2008110. Epub 2010 Mar 30. RNA. 2010. PMID: 20354153 Free PMC article.
-
Dynamical allosterism in the mechanism of action of DNA mismatch repair protein MutS.Biophys J. 2011 Oct 5;101(7):1730-9. doi: 10.1016/j.bpj.2011.08.039. Biophys J. 2011. PMID: 21961599 Free PMC article.
-
The molecular origin of the MMR-dependent apoptosis pathway from dynamics analysis of MutSα-DNA complexes.J Biomol Struct Dyn. 2012;30(3):347-61. doi: 10.1080/07391102.2012.680034. Epub 2012 Jun 18. J Biomol Struct Dyn. 2012. PMID: 22712459 Free PMC article.
References
-
- Abseher R, Nilges M. Are there non-trivial dynamic cross-correlations in proteins? J Mol Biol. 1998;279:911–920. - PubMed
-
- Ackers GK, Smith FR. Effects of Site-Specific Amino Acid Modification on Protein Interactions and Biological Function. Annu Rev Biochem. 1985;54:597–629. - PubMed
-
- Agarwal PK. Cis/trans Isomerization in HIV-1 Capsid Protein Catalyzed by Cyclophilin A: Insights from Computational and Theoretical Studies. Proteins: Struct, Funct, Bioinf. 2004;56:449–463. - PubMed
-
- Arcangeli C, Bizzarri AR, Cannistraro S. Long-term molecular dynamics simulation of copper azurin: structure, dynamics and functionality. Biophys Chem. 1999;78:247–257. - PubMed
Publication types
MeSH terms
Substances
Grants and funding
LinkOut - more resources
Full Text Sources
Miscellaneous
