Structural basis for interaction of O-acetylserine sulfhydrylase and serine acetyltransferase in the Arabidopsis cysteine synthase complex
- PMID: 17194764
- PMCID: PMC1785398
- DOI: 10.1105/tpc.106.047316
Structural basis for interaction of O-acetylserine sulfhydrylase and serine acetyltransferase in the Arabidopsis cysteine synthase complex
Abstract
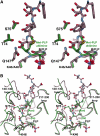
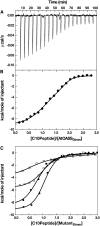
In plants, association of O-acetylserine sulfhydrylase (OASS) and Ser acetyltransferase (SAT) into the Cys synthase complex plays a regulatory role in sulfur assimilation and Cys biosynthesis. We determined the crystal structure of Arabidopsis thaliana OASS (At-OASS) bound with a peptide corresponding to the C-terminal 10 residues of Arabidopsis SAT (C10 peptide) at 2.9-A resolution. Hydrogen bonding interactions with key active site residues (Thr-74, Ser-75, and Gln-147) lock the C10 peptide in the binding site. C10 peptide binding blocks access to OASS catalytic residues, explaining how complex formation downregulates OASS activity. Comparison with bacterial OASS suggests that structural plasticity in the active site allows binding of SAT C termini with dissimilar sequences at structurally similar OASS active sites. Calorimetric analysis of the effect of active site mutations (T74S, S75A, S75T, and Q147A) demonstrates that these residues are important for C10 peptide binding and that changes at these positions disrupt communication between active sites in the homodimeric enzyme. We also demonstrate that the C-terminal Ile of the C10 peptide is required for molecular recognition by At-OASS. These results provide new insights into the molecular mechanism underlying formation of the Cys synthase complex and provide a structural basis for the biochemical regulation of Cys biosynthesis in plants.
Figures


Similar articles
-
Thermodynamics of the interaction between O-acetylserine sulfhydrylase and the C-terminus of serine acetyltransferase.Biochemistry. 2007 May 8;46(18):5586-94. doi: 10.1021/bi7001168. Epub 2007 Apr 11. Biochemistry. 2007. PMID: 17425333
-
Molecular basis of cysteine biosynthesis in plants: structural and functional analysis of O-acetylserine sulfhydrylase from Arabidopsis thaliana.J Biol Chem. 2005 Nov 18;280(46):38803-13. doi: 10.1074/jbc.M505313200. Epub 2005 Sep 15. J Biol Chem. 2005. PMID: 16166087
-
The narrow active-site cleft of O-acetylserine sulfhydrylase from Leishmania donovani allows complex formation with serine acetyltransferases with a range of C-terminal sequences.Acta Crystallogr D Biol Crystallogr. 2012 Aug;68(Pt 8):909-19. doi: 10.1107/S0907444912016459. Epub 2012 Jul 7. Acta Crystallogr D Biol Crystallogr. 2012. PMID: 22868756
-
The cysteine regulatory complex from plants and microbes: what was old is new again.Curr Opin Struct Biol. 2013 Apr;23(2):302-10. doi: 10.1016/j.sbi.2013.02.011. Epub 2013 Mar 17. Curr Opin Struct Biol. 2013. PMID: 23510784 Review.
-
Advancements in inhibitors of crucial enzymes in the cysteine biosynthetic pathway: Serine acetyltransferase and O-acetylserine sulfhydrylase.Chem Biol Drug Des. 2024 Jul;104(1):e14573. doi: 10.1111/cbdd.14573. Chem Biol Drug Des. 2024. PMID: 38965664 Review.
Cited by
-
Dual Role of a Biosynthetic Enzyme, CysK, in Contact Dependent Growth Inhibition in Bacteria.PLoS One. 2016 Jul 26;11(7):e0159844. doi: 10.1371/journal.pone.0159844. eCollection 2016. PLoS One. 2016. PMID: 27458806 Free PMC article.
-
Linkage and association study discovered loci and candidate genes for glycinin and β-conglycinin in soybean (Glycine max L. Merr.).Theor Appl Genet. 2021 Apr;134(4):1201-1215. doi: 10.1007/s00122-021-03766-6. Epub 2021 Jan 19. Theor Appl Genet. 2021. PMID: 33464377
-
Molecular Biology, Biochemistry and Cellular Physiology of Cysteine Metabolism in Arabidopsis thaliana.Arabidopsis Book. 2011;9:e0154. doi: 10.1199/tab.0154. Epub 2011 Dec 16. Arabidopsis Book. 2011. PMID: 22303278 Free PMC article.
-
Moonlighting O-acetylserine sulfhydrylase: New functions for an old protein.Biochim Biophys Acta. 2015 Sep;1854(9):1184-93. doi: 10.1016/j.bbapap.2015.02.013. Epub 2015 Feb 27. Biochim Biophys Acta. 2015. PMID: 25731080 Free PMC article. Review.
-
Assembly of the cysteine synthase complex and the regulatory role of protein-protein interactions.J Biol Chem. 2009 Apr 10;284(15):10268-75. doi: 10.1074/jbc.M900154200. Epub 2009 Feb 11. J Biol Chem. 2009. PMID: 19213732 Free PMC article.
References
-
- Berkowitz, O., Wirtz, M., Wolf, A., Kuhlmann, J., and Hell, R. (2002). Use of biomolecular interaction analysis to elucidate the regulatory mechanism of the cysteine synthase complex from Arabidopsis thaliana. J. Biol. Chem. 277 30629–30634. - PubMed
-
- Bogdanova, N., and Hell, R. (1997). Cysteine synthesis in plants: Protein-protein interactions of serine acetyltransferase from Arabidopsis thaliana. Plant J. 11 251–262. - PubMed
-
- Bonner, E.R., Cahoon, R.E., Knapke, S.M., and Jez, J.M. (2005). Molecular basis of cysteine biosynthesis in plants: Structural and functional analysis of O-acetylserine sulfhydrylase from Arabidopsis thaliana. J. Biol. Chem. 280 38803–38813. - PubMed
-
- Brünger, A.T., et al. (1998). Crystallography & NMR system: A new software suite for macromolecular structure determination. Acta Crystallogr. D. Biol. Crystallogr. 54 905–921. - PubMed
-
- Burkhard, P., Rao, G.S., Hohenester, E., Schnackerz, K.D., Cook, P.F., and Jansonius, J.N. (1998). Three-dimensional structure of O-acetylserine sulfhydrylase from Salmonella typhimurium. J. Mol. Biol. 283 121–133. - PubMed
Publication types
MeSH terms
Substances
Associated data
- Actions
LinkOut - more resources
Full Text Sources
Other Literature Sources
Molecular Biology Databases
Research Materials

