. 2006 Dec;18(12):3458-75.
doi: 10.1105/tpc.106.046227. Epub 2006 Dec 28.

Reduction of benzenoid synthesis in petunia flowers reveals multiple pathways to benzoic acid and enhancement in auxin transport

Affiliations

Reduction of benzenoid synthesis in petunia flowers reveals multiple pathways to benzoic acid and enhancement in auxin transport

Irina Orlova et al. Plant Cell. 2006 Dec.

Abstract

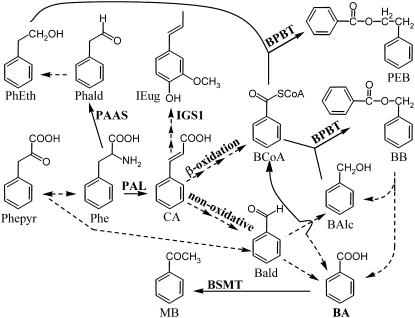
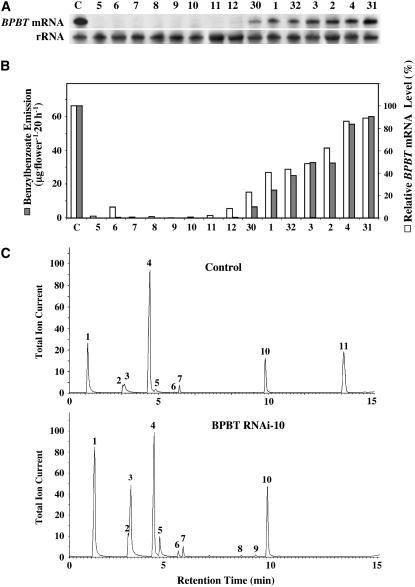
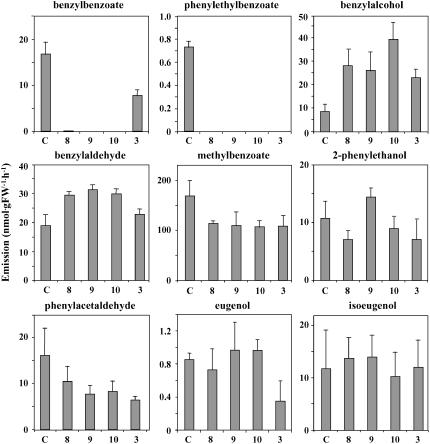
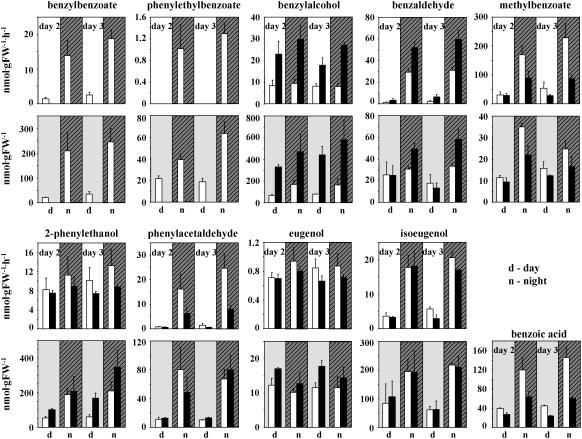
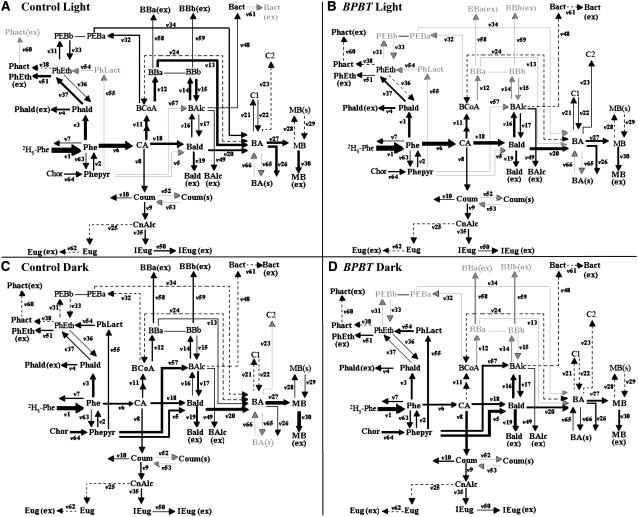
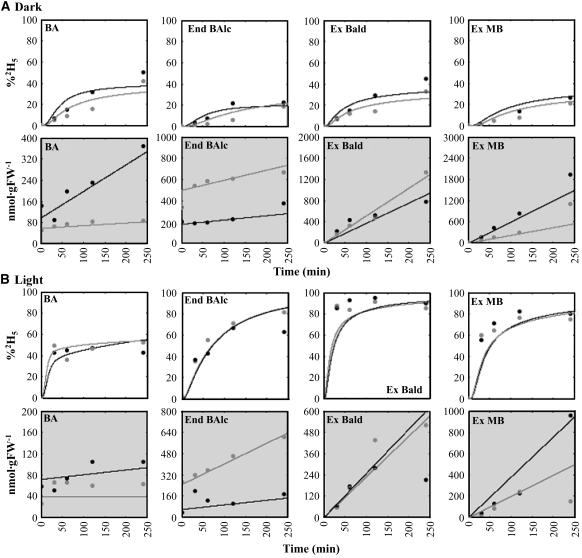
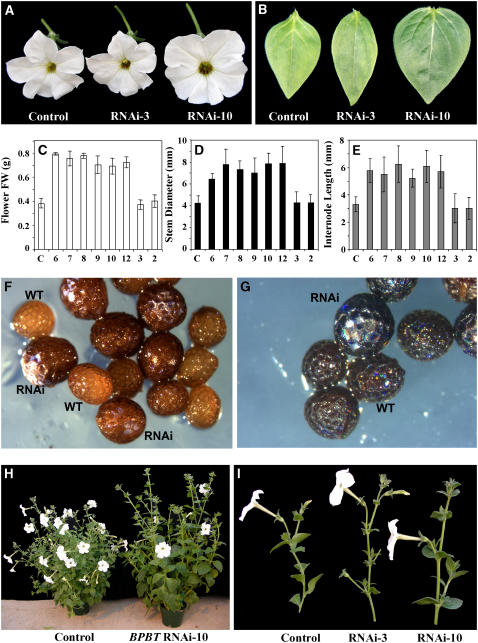
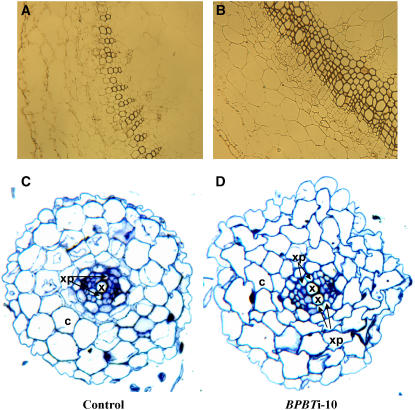
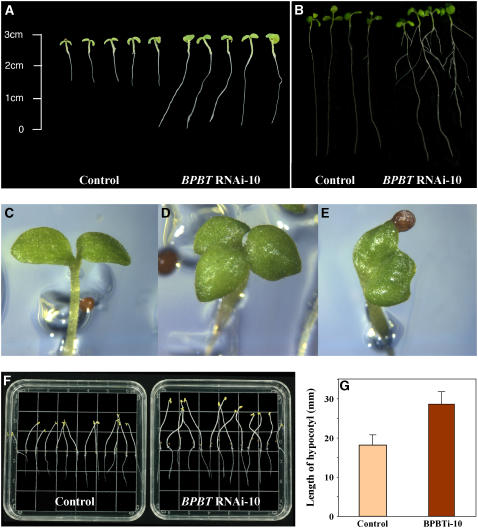
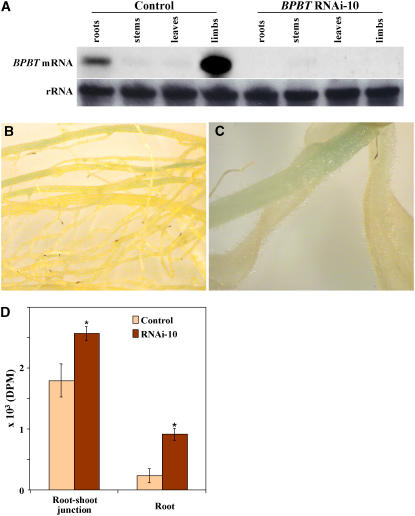
In plants, benzoic acid (BA) is believed to be synthesized from Phe through shortening of the propyl side chain by two carbons. It is hypothesized that this chain shortening occurs via either a beta-oxidative or non-beta-oxidative pathway. Previous in vivo isotope labeling and metabolic flux analysis of the benzenoid network in petunia (Petunia hybrida) flowers revealed that both pathways yield benzenoid compounds and that benzylbenzoate is an intermediate between L-Phe and BA. To test this hypothesis, we generated transgenic petunia plants in which the expression of BPBT, the gene encoding the enzyme that uses benzoyl-CoA and benzyl alcohol to make benzylbenzoate, was reduced or eliminated. Elimination of benzylbenzoate formation decreased the endogenous pool of BA and methylbenzoate emission but increased emission of benzyl alcohol and benzylaldehyde, confirming the contribution of benzylbenzoate to BA formation. Labeling experiments with 2H5-Phe revealed a dilution of isotopic abundance in most measured compounds in the dark, suggesting an alternative pathway from a precursor other than Phe, possibly phenylpyruvate. Suppression of BPBT activity also affected the overall morphology of petunia plants, resulting in larger flowers and leaves, thicker stems, and longer internodes, which was consistent with the increased auxin transport in transgenic plants. This suggests that BPBT is involved in metabolic processes in vegetative tissues as well.


Figures

Figure 1.
Figure 1.
Main Biochemical Reactions Leading to the Synthesis of Benzenoid Volatiles in Petunia Flowers. Some reactions are hypothesized (dashed arrows) and have not been shown conclusively to occur in petunia. See text for details. BAlc, benzyl alcohol; Bald, benzylaldehyde; BB, benzylbenzoate; BCoA, benzoyl-CoA; CA, trans-cinnamic acid; IEug, isoeugenol; MB, methylbenzoate; PEB, phenylethyl benzoate; Phald, phenylacetaldehyde; Phe, l-Phe; PhEth, 2-phenylethanol; Phepyr, phenylpyruvic acid; BPBT, benzoyl-CoA:benzyl alcohol/2-phenylethanol benzoyltransferase; BSMT, benzoic acid/salicylic acid carboxyl methyltransferase; IGS1, isoeugenol synthase; PAAS, phenylacetaldehyde synthase.
Figure 2.
Figure 2.
Effect of BPBT Silencing on Benzylbenzoate Emission. (A) BPBT mRNA levels in corollas of control and different transgenic BPBT RNAi petunia lines. Representative RNA gel blot hybridization with total RNA (5 μg per lane) isolated from the limbs of corollas of 2-d-old control (C) petunia flowers and flowers from independent transgenic lines (numbers on top of the gel). A coding region of the BPBT genes was used as a probe. Autoradiography was performed overnight. The blot was rehybridized with an 18S rDNA probe (bottom gel) to standardize samples. (B) Benzylbenzoate emission and the relative BPBT mRNA levels in control and transgenic BPBT RNAi petunia flowers. Floral volatiles were collected from petunia flowers using the closed-loop stripping method. The numbers represent independent transgenic lines (C, control). The relative BPBT mRNA levels were obtained by scanning RNA gel blots with a phosphor imager and corrected by standardizing for the amounts of 18S rRNA measured in the same runs. The transcript level in control plants was taken as 100%. (C) Metabolic profiling of benzenoid compounds emitted from control (top chromatogram) and BPBT RNAi (bottom chromatogram) petunia flowers. The BPBT RNAi-10 transgenic line was used as an example. Floral scent collected from detached flowers of control and BPBT RNAi-10 transgenic plants was analyzed by electron ionization gas chromatography–mass spectrometry, and total ion currents are plotted. Compounds were identified based on their mass spectra and retention time: 1, benzaldehyde; 2, phenylacetaldehyde; 3, benzyl alcohol; 4, methylbenzoate; 5, 2-phenylethanol; 6, benzylacetate; 7, internal standard (naphthalene); 8, phenylethylacetate; 9, eugenol; 10, isoeugenol; 11, benzylbenzoate.
Figure 3.
Figure 3.
Effect of BPBT Silencing on Emission of Benzenoid/Phenylpropanoid Compounds in Petunia Flowers. Flowers from four independent BPBT RNAi lines, 8, 9, and 10 (knockouts) and 3 (knockdown), and control (C) were used for scent collection. Each graph represents the average of four to five independent experiments. Scent was collected for 12 h from detached flowers in the dark, and levels of volatiles were quantified by GC-MS. Emission rates are expressed on a per hour basis, assuming a constant emission rate over the 12-h period. Bars indicate sd.
Figure 4.
Figure 4.
Rhythmic Changes in Emission and Internal Pools of Benzenoid/Phenylpropanoid Compounds in Petal Tissue of Control and BPBT Knockout Petunia Plants. Data represent the average pools and emission rates from three independent experiments performed over a 48-h period beginning with 2-d-old control (white bars) and BPBT RNAi-10 transgenic (black bars) flowers. Headspace collections were performed for 12 h, and samples were taken at 8 am (night points) and 8 pm (day points). Tissue for internal pools was collected at 9 am (day points) and 9 pm (night points). Emission rates are shown in the top graphs with white backgrounds, while internal pools for the corresponding volatiles are shown in the bottom graphs with gray backgrounds. Striped areas indicate night period. Bars indicate sd.
Figure 5.
Figure 5.
Four Models Representing the Benzenoid Network in the Light and Dark in Control and BPBT Knockout Petunia Flowers. Computer-assisted metabolic modeling was performed using in vivo labeling kinetics and pool sizes of benzenoid and phenylpropanoid compounds in petunia petal tissue supplied with 2H5-Phe for up to 4 h in light ([A] and [B]) and dark ([C] and [D]) conditions in control ([A] and [C]) and BPBT RNAi-10 transgenic ([B] and [D]) plants. Thickness of lines correlates with strength of flux (see Table 1). Gray arrows indicate the absence of flux, and dashed lines indicate very low flux rate. Bact, benzylacetate; BBa, benzylbenzoate BA moiety; BBb, benzylbenzoate BAlc moiety; C1 and C2, unidentified nonvolatile BA conjugates (Boatright et al., 2004); Chor, chorismic acid; CnAlc, coniferyl alcohol; Coum, coumaric acid; Eug, eugenol; PEBa, phenylethyl benzoate BA moiety; PEBb, phenylethyl benzoate 2-phenylethanol moiety; Phact, phenylethylacetate; PhLact, phenyllactic acid. For remaining abbreviations, see Figure 1.
Figure 6.
Figure 6.
Pool Sizes and Isotopic Abundances of Representative Compounds within the Benzenoid Network in Control and BPBT RNAi-10 Flowers. Pool sizes and isotopic abundances are shown for BA, endogenous benzyl alcohol (End Balc), exogenous benzaldehyde (Ex Bald), and exogenous methylbenzoate (Ex MB) in the dark (A) and in the light (B). Charts with white background show experimentally determined and model-simulated isotopic labeling of key intermediates and end products. Charts with gray backgrounds show pool sizes of the various metabolites over a 4-h time course of feeding with 2H5-Phe. Simulated labeling curves and pool sizes (lines) were generated using the flux rates and initial pool sizes specified in Table 1 and are superimposed upon observed values (symbols). Controls are shown in black, and BPBT RNAi transgenics are shown in gray.
Figure 7.
Figure 7.
Phenotypical Changes in BPBT RNAi Knockout Petunia Plants. BPBT RNAi-10 knockout transgenic plants show increased flower size (A) and larger, more rounded leaves (B) than control and BPBT RNAi-3 knockdown plants. Increased flower size is manifested in increased flower weight (C), and this consistently caused a significant increase in all knockouts (6, 7, 8, 9, 10, and 12) in comparison with controls (C) and knockdowns (2 and 3). Knockouts also showed significantly increased stem diameter (D) and internode lengths (E). Each point in (C) to (E) represents the average of 7, 15, and 13 measurements, respectively. Bars indicate sd. These morphological changes are further illustrated in panels (H) and (I). BPBT RNAi-10 seeds are also larger and darker than controls (WT) (F). DMACA staining of both control and RNAi seeds is shown in (G).
Figure 8.
Figure 8.
Effects of BPBT Gene Knockout on the Histological Structure of Petunia Stems and Roots. Cross sections of the middle part of the first-order internodes of 3-week-old nonflowering plants, stained with Mäule reagent, showed increased secondary growth and a proliferation of vascular tissue, particularly the xylem in BPBT RNAi-10 transgenic plants (B) in comparison with the control (A). Root cross sections of control (C) and BPBT RNAi-10 (D) transgenic plants showed a doubling of central xylem (x) and xylem pole (xp) cells and a loss of uniformity in cortical cells (c) of knockout plants.
Figure 9.
Figure 9.
Effect of BPBT Gene Silencing on Morphology of Petunia Seedlings. Five-day-old (A) and 10-d-old (B) control and BPBT RNAi-10 seedlings grown under normal light/dark (12 h/12 h) conditions on half-strength MS medium. Five-day-old knockout seedlings exhibited fused (E) or supernumerary (D) cotyledons more frequently than controls (C). Etiolated 10-d-old seedlings of BPBT RNAi-10 grown on half-strength MS medium show elongated hypocotyls ([F] and [G]) in comparison with the control. Values are the average of 13 measurements. Bars indicate sd.
Figure 10.
Figure 10.
BPBT Expression, Spatial Activity of the C. breweri Lis Gene Promoter, and Auxin Transport in Petunia. (A) Representative RNA gel blot hybridization with total RNA (7 μg per lane) isolated from roots, stems, leaves, and corollas of 2-d-old flowers of control and BPBT RNAi-10 petunia plants. A coding region of the BPBT genes was used as a probe. Autoradiography was performed overnight. The blot was rehybridized with an 18S rDNA probe (bottom gel) to standardize samples. (B) and (C) Histochemical analysis of GUS activity in four independent Lis-GUS transgenic plants revealed the presence of low levels of Lis-GUS expression in roots (B) and basal parts of the stems (C) of these plants. (D) Auxin transport in roots and root-shoot junctions of 5-d-old control and BPBT RNAi-10 seedlings. Radiolabeled 3H-auxin was applied to the shoot tip, and its movement to the root-shoot transition zone and root tip over a 4-h period was monitored. Asterisks indicate significance determined by Student's t test (P < 0.02; n = 10). Bars indicate sd. DPM, disintegrations per minute.

Similar articles

Cited by

References

    1. Ahmed, M.A., El-Mawla, A., and Beerhues, L. (2002). Benzoic acid biosynthesis in cell cultures of Hypericum androsaemum. Planta 214 727–733. - PubMed
    1. Al-Hammadi, A.S., Sreelakshmi, Y., Negi, S., Siddiqi, I., and Sharma, R. (2003). The polycotyledon mutant of tomato shows enhanced polar auxin transport. Plant Physiol. 133 113–125. - PMC - PubMed
    1. Baxter, I.R., Young, J.C., Armstrong, G., Foster, N., Bogenschutz, N., Cordova, T., Peer, W.A., Hazen, S.P., Murphy, A.S., and Harper, J.F. (2005). A plasma membrane H+-ATPase is required for the formation of proanthocyanidins in the seed coat endothelium of Arabidopsis thaliana. Proc. Natl. Acad. Sci. USA 102 2649–2654. - PMC - PubMed
    1. Bennett, S.R.M., Alvarez, J., Bossinger, G., and Smyth, D.R. (1995). Morphogenesis in pinoid mutants of Arabidopsis thaliana. Plant J. 8 505–520.
    1. Beuerle, T., and Pichersky, E. (2002). Purification and characterization of benzoate:coenzyme A ligase from Clarkia breweri. Arch. Biochem. Biophys. 400 258–264. - PubMed

Publication types

MeSH terms

Associated data