

Consistent patterns of rate asymmetry and gene loss indicate widespread neofunctionalization of yeast genes after whole-genome duplication
- PMID: 17194778
- PMCID: PMC1840088
- DOI: 10.1534/genetics.106.066951
Consistent patterns of rate asymmetry and gene loss indicate widespread neofunctionalization of yeast genes after whole-genome duplication
Abstract
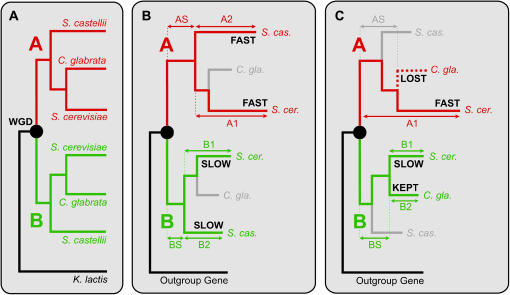
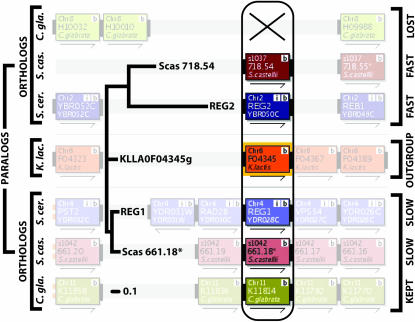
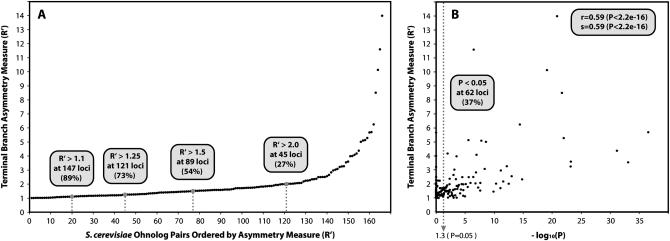
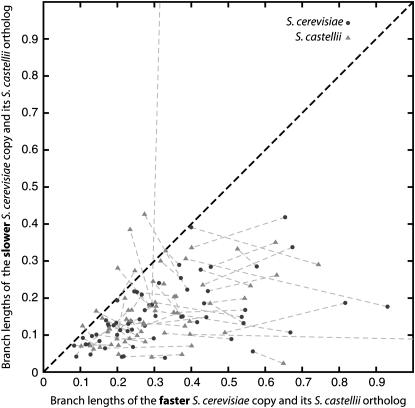
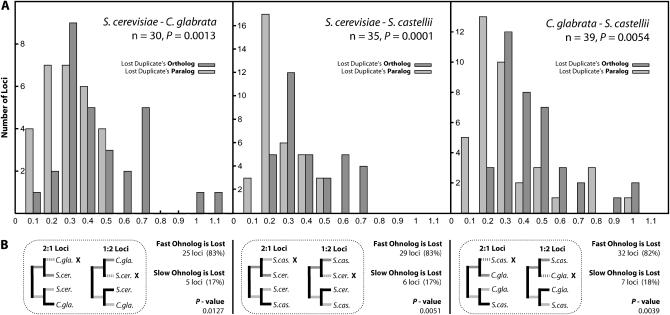
We investigated patterns of rate asymmetry in sequence evolution among the gene pairs (ohnologs) formed by whole-genome duplication (WGD) in yeast species. By comparing three species (Saccharomyces cerevisiae, Candida glabrata, and S. castellii) that underwent WGD to a nonduplicated outgroup (Kluyveromyces lactis), and by using a synteny framework to establish orthology and paralogy relationships at each duplicated locus, we show that 56% of ohnolog pairs show significantly asymmetric protein sequence evolution. For ohnolog pairs that remain duplicated in two species there is a strong tendency for the faster-evolving copy in one species to be orthologous to the faster copy in the other species, which indicates that the evolutionary rate differences were established before speciation and hence soon after the WGD. We also present evidence that in cases where one ohnolog has been lost from the genome of a post-WGD species, the lost copy was likely to have been the faster-evolving member of the pair prior to its loss. These results suggest that a significant fraction of the retained ohnologs in yeast species underwent neofunctionalization soon after duplication.
Figures
Similar articles
-
Parallel Nonfunctionalization of CK1δ/ε Kinase Ohnologs Following a Whole-Genome Duplication Event.Mol Biol Evol. 2023 Dec 1;40(12):msad246. doi: 10.1093/molbev/msad246. Mol Biol Evol. 2023. PMID: 37979156 Free PMC article.
-
Independent sorting-out of thousands of duplicated gene pairs in two yeast species descended from a whole-genome duplication.Proc Natl Acad Sci U S A. 2007 May 15;104(20):8397-402. doi: 10.1073/pnas.0608218104. Epub 2007 May 9. Proc Natl Acad Sci U S A. 2007. PMID: 17494770 Free PMC article.
-
Rate asymmetry after genome duplication causes substantial long-branch attraction artifacts in the phylogeny of Saccharomyces species.Mol Biol Evol. 2006 Feb;23(2):245-53. doi: 10.1093/molbev/msj027. Epub 2005 Oct 5. Mol Biol Evol. 2006. PMID: 16207937
-
Naumovozyma castellii: an alternative model for budding yeast molecular biology.Yeast. 2017 Mar;34(3):95-109. doi: 10.1002/yea.3218. Epub 2016 Dec 2. Yeast. 2017. PMID: 27794167 Review.
-
Evolutionary relationships between Saccharomyces cerevisiae and other fungal species as determined from genome comparisons.Rev Iberoam Micol. 2005 Dec;22(4):217-22. doi: 10.1016/s1130-1406(05)70046-2. Rev Iberoam Micol. 2005. PMID: 16499414 Review.
Cited by
-
Gene expression in a paleopolyploid: a transcriptome resource for the ciliate Paramecium tetraurelia.BMC Genomics. 2010 Oct 8;11:547. doi: 10.1186/1471-2164-11-547. BMC Genomics. 2010. PMID: 20932287 Free PMC article.
-
The impact of local genomic properties on the evolutionary fate of genes.Elife. 2023 May 24;12:e82290. doi: 10.7554/eLife.82290. Elife. 2023. PMID: 37223962 Free PMC article.
-
Parallel nonfunctionalization of CK1δ/ε kinase ohnologs following a whole-genome duplication event.bioRxiv [Preprint]. 2023 Oct 2:2023.10.02.560513. doi: 10.1101/2023.10.02.560513. bioRxiv. 2023. Update in: Mol Biol Evol. 2023 Dec 1;40(12):msad246. doi: 10.1093/molbev/msad246. PMID: 37873368 Free PMC article. Updated. Preprint.
-
Evolution of stress-regulated gene expression in duplicate genes of Arabidopsis thaliana.PLoS Genet. 2009 Jul;5(7):e1000581. doi: 10.1371/journal.pgen.1000581. Epub 2009 Jul 31. PLoS Genet. 2009. PMID: 19649161 Free PMC article.
-
From pairs of most similar sequences to phylogenetic best matches.Algorithms Mol Biol. 2020 Apr 9;15:5. doi: 10.1186/s13015-020-00165-2. eCollection 2020. Algorithms Mol Biol. 2020. PMID: 32308731 Free PMC article.
References
-
- Benjamini, Y., and Y. Hockberg, 1995. Controlling the false discovery rate: a practical and powerful approach to multiple testing. J. R. Stat. Soc. B 57: 289–300.
-
- Byrne, K. P., and G. Blanc, 2006. Computational analyses of ancient polyploidy. Curr. Bioinform. 1: 131–146.
-
- Byrnes, J. K., G. P. Morris and W. H. Li, 2006. Reorganization of adjacent gene relationships in yeast genomes by whole-genome duplication and gene deletion. Mol. Biol. Evol. 23: 1136–1143. - PubMed
Publication types
MeSH terms
LinkOut - more resources
Full Text Sources
Molecular Biology Databases
