

Phylogenetic mapping of recombination hotspots in human immunodeficiency virus via spatially smoothed change-point processes
- PMID: 17194781
- PMCID: PMC1855141
- DOI: 10.1534/genetics.106.066258
Phylogenetic mapping of recombination hotspots in human immunodeficiency virus via spatially smoothed change-point processes
Abstract
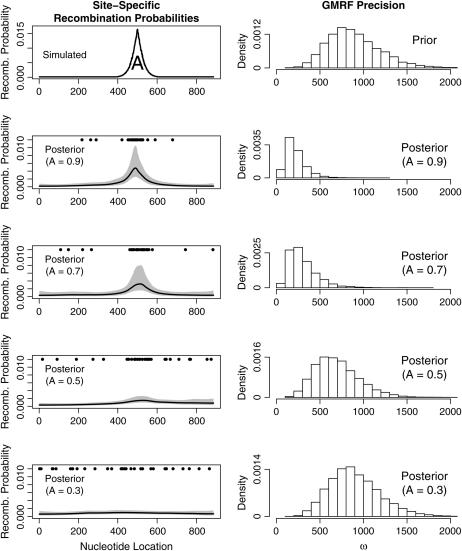
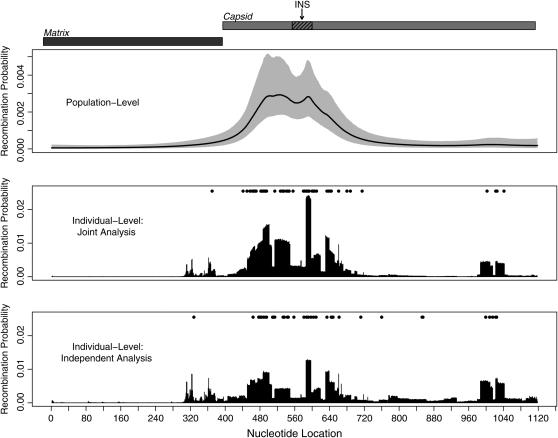
We present a Bayesian framework for inferring spatial preferences of recombination from multiple putative recombinant nucleotide sequences. Phylogenetic recombination detection has been an active area of research for the last 15 years. However, only recently attempts to summarize information from several instances of recombination have been made. We propose a hierarchical model that allows for simultaneous inference of recombination breakpoint locations and spatial variation in recombination frequency. The dual multiple change-point model for phylogenetic recombination detection resides at the lowest level of our hierarchy under the umbrella of a common prior on breakpoint locations. The hierarchical prior allows for information about spatial preferences of recombination to be shared among individual data sets. To overcome the sparseness of breakpoint data, dictated by the modest number of available recombinant sequences, we a priori impose a biologically relevant correlation structure on recombination location log odds via a Gaussian Markov random field hyperprior. To examine the capabilities of our model to recover spatial variation in recombination frequency, we simulate recombination from a predefined distribution of breakpoint locations. We then proceed with the analysis of 42 human immunodeficiency virus (HIV) intersubtype gag recombinants and identify a putative recombination hotspot.
Figures


Similar articles
-
Dual multiple change-point model leads to more accurate recombination detection.Bioinformatics. 2005 Jul 1;21(13):3034-42. doi: 10.1093/bioinformatics/bti459. Epub 2005 May 24. Bioinformatics. 2005. PMID: 15914546
-
SlidingBayes: exploring recombination using a sliding window approach based on Bayesian phylogenetic inference.Bioinformatics. 2005 Apr 1;21(7):1274-5. doi: 10.1093/bioinformatics/bti139. Epub 2004 Nov 16. Bioinformatics. 2005. PMID: 15546940
-
Are you my mother? Bayesian phylogenetic inference of recombination among putative parental strains.Appl Bioinformatics. 2003;2(3):131-44. Appl Bioinformatics. 2003. PMID: 15130798 Review.
-
Oh brother, where art thou? A Bayes factor test for recombination with uncertain heritage.Syst Biol. 2002 Oct;51(5):715-28. doi: 10.1080/10635150290102384. Syst Biol. 2002. PMID: 12396586
-
Chi hotspots of generalized recombination.Cell. 1983 Oct;34(3):709-10. doi: 10.1016/0092-8674(83)90525-1. Cell. 1983. PMID: 6354468 Review. No abstract available.
Cited by
-
Ecosystem simplification, biodiversity loss and plant virus emergence.Curr Opin Virol. 2015 Feb;10:56-62. doi: 10.1016/j.coviro.2015.01.005. Epub 2015 Jan 29. Curr Opin Virol. 2015. PMID: 25638504 Free PMC article. Review.
-
Plasmodium falciparum erythrocyte membrane protein 1 diversity in seven genomes--divide and conquer.PLoS Comput Biol. 2010 Sep 16;6(9):e1000933. doi: 10.1371/journal.pcbi.1000933. PLoS Comput Biol. 2010. PMID: 20862303 Free PMC article.
-
A spatially varying change points model for monitoring glaucoma progression using visual field data.Spat Stat. 2019 Apr;30:1-26. doi: 10.1016/j.spasta.2019.02.001. Epub 2019 Feb 22. Spat Stat. 2019. PMID: 30931247 Free PMC article.
-
Revisiting the recombinant history of HIV-1 group M with dynamic network community detection.Proc Natl Acad Sci U S A. 2022 May 10;119(19):e2108815119. doi: 10.1073/pnas.2108815119. Epub 2022 May 2. Proc Natl Acad Sci U S A. 2022. PMID: 35500121 Free PMC article.
-
Recombination plasticity in response to temperature variation in reptiles.PLoS Genet. 2025 Aug 4;21(8):e1011772. doi: 10.1371/journal.pgen.1011772. eCollection 2025 Aug. PLoS Genet. 2025. PMID: 40758762 Free PMC article.
References
-
- Awadalla, P., 2003. The evolutionary genomics of pathogen recombination. Nat. Rev. Genet. 4: 50–60. - PubMed
-
- Balakrishnan, M., P. Fay and R. A. Bambara, 2001. The kissing hairpin sequence promotes recombination within the HIV-I 5′ leader region. J. Biol. Chem. 276: 36482–36492. - PubMed
-
- Barlow, K., I. Tatt, P. Cane, D. Pillay and J. Clewley, 2001. Recombinant strains of HIV type 1 in the United Kingdom. AIDS Res. Hum. Retroviruses 17: 467–474. - PubMed
-
- Bernardinelli, L., D. Clayton and C. Montomoli, 1995. Bayesian estimates of disease maps: How important are priors? Stat. Med. 14: 2411–2431. - PubMed
-
- Besag, J., 1974. Spatial interaction and the statistical analysis of lattice systems (with discussion). J. R. Stat. Soc. Ser. B 36: 192–236.
Publication types
MeSH terms
Substances
Grants and funding
LinkOut - more resources
Full Text Sources
