

Background selection in single genes may explain patterns of codon bias
- PMID: 17194784
- PMCID: PMC1840058
- DOI: 10.1534/genetics.106.065557
Background selection in single genes may explain patterns of codon bias
Abstract
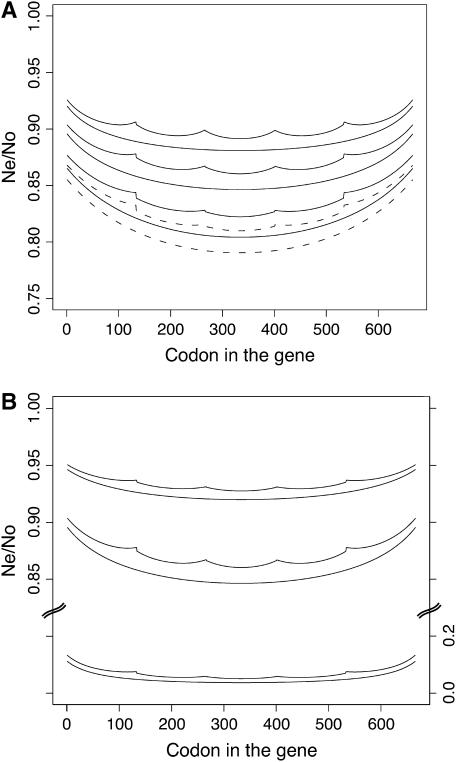
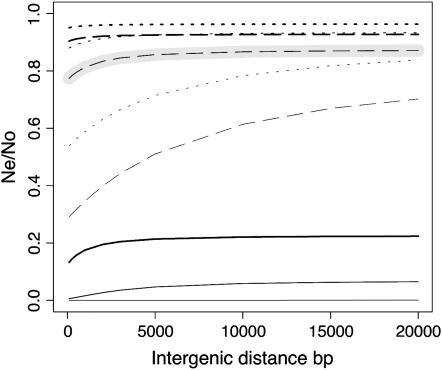
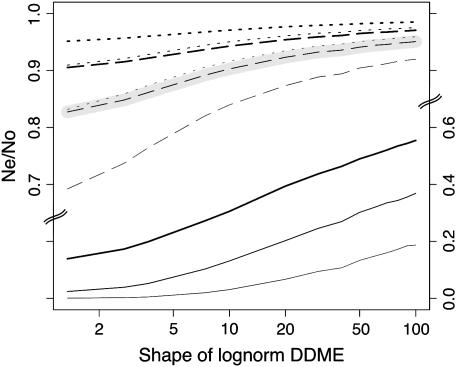
Background selection involves the reduction in effective population size caused by the removal of recurrent deleterious mutations from a population. Previous work has examined this process for large genomic regions. Here we focus on the level of a single gene or small group of genes and investigate how the effects of background selection caused by nonsynonymous mutations are influenced by the lengths of coding sequences, the number and length of introns, intergenic distances, neighboring genes, mutation rate, and recombination rate. We generate our predictions from estimates of the distribution of the fitness effects of nonsynonymous mutations, obtained from DNA sequence diversity data in Drosophila. Results for genes in regions with typical frequencies of crossing over in Drosophila melanogaster suggest that background selection may influence the effective population sizes of different regions of the same gene, consistent with observed differences in codon usage bias along genes. It may also help to cause the observed effects of gene length and introns on codon usage. Gene conversion plays a crucial role in determining the sizes of these effects. The model overpredicts the effects of background selection with large groups of nonrecombining genes, because it ignores Hill-Robertson interference among the mutations involved.
Figures


Similar articles
-
Population, evolutionary and genomic consequences of interference selection.Genetics. 2002 May;161(1):389-410. doi: 10.1093/genetics/161.1.389. Genetics. 2002. PMID: 12019253 Free PMC article.
-
Selection on codon usage in Drosophila americana.Curr Biol. 2004 Jan 20;14(2):150-4. doi: 10.1016/j.cub.2003.12.055. Curr Biol. 2004. PMID: 14738738
-
Reduced efficacy of selection in regions of the Drosophila genome that lack crossing over.Genome Biol. 2007;8(2):R18. doi: 10.1186/gb-2007-8-2-r18. Genome Biol. 2007. PMID: 17284312 Free PMC article.
-
Codon bias evolution in Drosophila. Population genetics of mutation-selection drift.Gene. 1997 Dec 31;205(1-2):269-78. doi: 10.1016/s0378-1119(97)00400-9. Gene. 1997. PMID: 9461401 Review.
-
Genetic recombination and molecular evolution.Cold Spring Harb Symp Quant Biol. 2009;74:177-86. doi: 10.1101/sqb.2009.74.015. Epub 2009 Sep 4. Cold Spring Harb Symp Quant Biol. 2009. PMID: 19734202 Review.
Cited by
-
Mutation and the evolution of recombination.Philos Trans R Soc Lond B Biol Sci. 2010 Apr 27;365(1544):1281-94. doi: 10.1098/rstb.2009.0320. Philos Trans R Soc Lond B Biol Sci. 2010. PMID: 20308104 Free PMC article. Review.
-
The effects of deleterious mutations on evolution at linked sites.Genetics. 2012 Jan;190(1):5-22. doi: 10.1534/genetics.111.134288. Genetics. 2012. PMID: 22219506 Free PMC article. Review.
-
Distortions in genealogies due to purifying selection and recombination.Genetics. 2013 Sep;195(1):221-30. doi: 10.1534/genetics.113.152983. Epub 2013 Jul 2. Genetics. 2013. PMID: 23821597 Free PMC article.
-
Natural selection shapes nucleotide polymorphism across the genome of the nematode Caenorhabditis briggsae.Genome Res. 2010 Aug;20(8):1103-11. doi: 10.1101/gr.104331.109. Epub 2010 May 27. Genome Res. 2010. PMID: 20508143 Free PMC article.
-
Evolution of synonymous codon usage in Neurospora tetrasperma and Neurospora discreta.Genome Biol Evol. 2011;3:332-43. doi: 10.1093/gbe/evr018. Epub 2011 Mar 14. Genome Biol Evol. 2011. PMID: 21402862 Free PMC article.
References
-
- Adams, M. D., S. E. Celniker, R. A. Holt, C. A. Evans, J. D. Gocayne et al., 2000. The genome sequence of Drosophila melanogaster. Science 287: 2185–2195. - PubMed
-
- Aitchison, J., and J. A. C. Brown, 1957. The Lognormal Distribution, With Special Reference to Its Uses in Economics. Cambridge University Press, Cambridge, UK.
Publication types
MeSH terms
Substances
LinkOut - more resources
Full Text Sources
Medical
Molecular Biology Databases
