

Review
doi: 10.1371/journal.pcbi.0020174.
Modularity and dynamics of cellular networks
Affiliations
- PMID: 17196032
- PMCID: PMC1761653
- DOI: 10.1371/journal.pcbi.0020174
Item in Clipboard
Review
Modularity and dynamics of cellular networks
PLoS Comput Biol.
.
No abstract available
Conflict of interest statement
Figures

Recent high-throughput technologies have produced massive amounts of gene expression, macromolecular interaction, or other type of “omic” data. Using a computational modeling approach, the architecture of cellular networks can be learned from these “omic” data, and topological or functional units (motifs and modules) can be identified from these networks. Comparisons of cellular networks across different species may reveal how network structures evolve. In particular, the evolutionary conservation of motifs and modules can be an indication of their biological importance. A dynamic view of cellular networks describes active network components and interactions under various conditions and time points. Network motifs and modules can also be time-dependent or condition-specific.
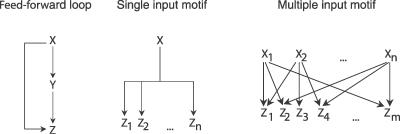
(Left) Feed-forward loop: TF X regulates TF Y, and both X and Y jointly regulate gene Z. (Middle) Single-input motif: TF X regulates genes Z1, Z2… and Zn. (Right) Multi-input motif: a set of TFs X1, X2… and Xn regulate a set of target genes Z1, Z2… and Zm. (Reproduced from [12].)
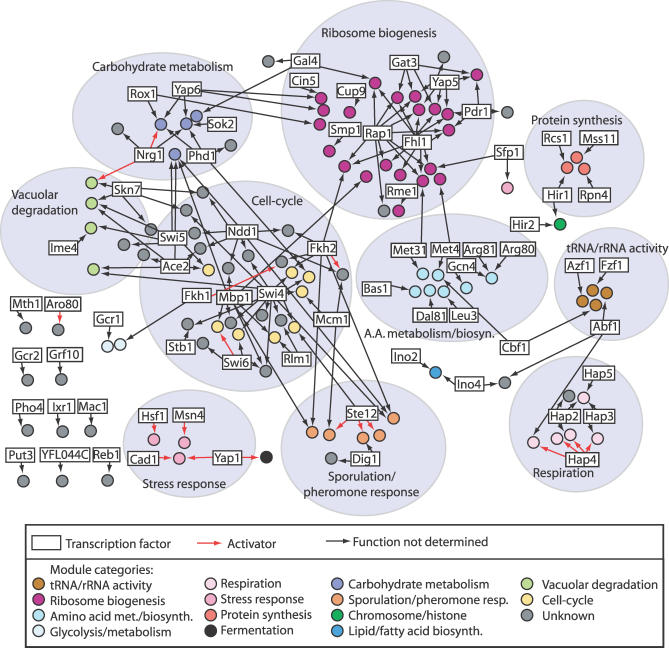
Nodes represent modules, and boxes around the modules represent module groups. Directed edges represent regulatory relationship. The functional categories of the modules are color-coded. (Reproduced from [15].)

(Upper panels) Shows a feed-forward loop, where Y is an accumulation of X over time, and the product of X and Y passes a threshold (thin horizontal line) to activate Z. This loop rejects impulsive perturbations in X, and responds only to persistent activation. This is because Y increases gradually to pass the threshold. A similar rejection of impulsive fluctuations can be achieved by a feed-forward chain, where X activates Y and Y activates Z. However, a feed-forward chain responds slower (thin red curve) to the off signal than to the loop. (Lower panels) Shows a single-input motif, where X regulates Z1, Z2, and Z3 (n = 3). When X changes over time, Z1, Z2, and Z3 are activated and deactivated in order, based on their thresholds. In particular, Z1, which has the lowest threshold, is activated first and deactivated last. (Reproduced from [12].)
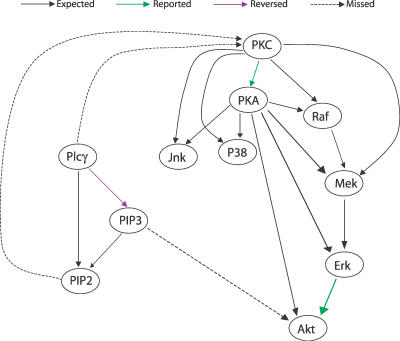
Nodes in the network represent key signaling molecules. Directed edges represent predicted causal relationships between signaling molecules. Edges are categorized into different classes: (i) well-established interactions in the literature (“expected”); (ii) interactions that have been reported but weakly supported (“reported”); (iii) well-established interactions that Bayesian networks failed to predict (“missing”); (iv) predicted causal relationship in a direction opposite to the literature (“reversed”). (Reproduced from [39].)

Genes that share similar expression profiles across conditions are grouped together by clustering.
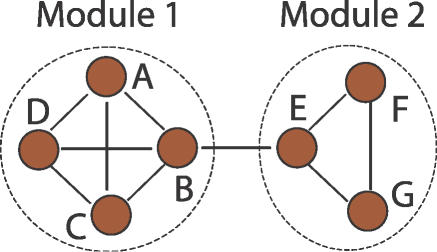
Densely connected subgraphs can be identified from interaction networks, suggesting the existence of multi-component complexes.

Directed acyclic graphical models are called Bayesian networks. In the shown Bayesian network, values of variable Y depend directly on values of X, and values of variable Z1 and Z2 depend directly on values of Y.
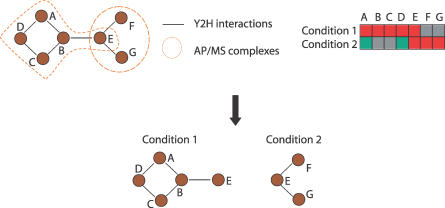
The integration of a variety of datasets, including binary interactions, protein complexes, and expression profiles enables the identification of subnetworks that are active under certain conditions.
References
-
- Lockhart DJ, Winzeler EA. Genomics, gene expression and DNA arrays. Nature. 2000;405:827–836. - PubMed
-
- Walhout AJ, Vidal M. Protein interaction maps for model organisms. Nat Rev Mol Cell Biol. 2001;2:55–62. - PubMed
-
- Lee TI, Rinaldi NJ, Robert F, Odom DT, Bar-Joseph Z, et al. Transcriptional regulatory networks in Saccharomyces cerevisiae . Science. 2002;298:799–804. - PubMed
-
- Drewes G, Bouwmeester T. Global approaches to protein–protein interactions. Curr Opin Cell Biol. 2003;15:199–205. - PubMed
Publication types
MeSH terms
LinkOut - more resources
Full Text Sources
