. 2006 Dec 29:7:544.
doi: 10.1186/1471-2105-7-544.

The Virtual Insect Brain protocol: creating and comparing standardized neuroanatomy

Affiliations

The Virtual Insect Brain protocol: creating and comparing standardized neuroanatomy

Arnim Jenett et al. BMC Bioinformatics. .

Abstract

Background: In the fly Drosophila melanogaster, new genetic, physiological, molecular and behavioral techniques for the functional analysis of the brain are rapidly accumulating. These diverse investigations on the function of the insect brain use gene expression patterns that can be visualized and provide the means for manipulating groups of neurons as a common ground. To take advantage of these patterns one needs to know their typical anatomy.

Results: This paper describes the Virtual Insect Brain (VIB) protocol, a script suite for the quantitative assessment, comparison, and presentation of neuroanatomical data. It is based on the 3D-reconstruction and visualization software Amira, version 3.x (Mercury Inc.) 1. Besides its backbone, a standardization procedure which aligns individual 3D images (series of virtual sections obtained by confocal microscopy) to a common coordinate system and computes average intensities for each voxel (volume pixel) the VIB protocol provides an elaborate data management system for data administration. The VIB protocol facilitates direct comparison of gene expression patterns and describes their interindividual variability. It provides volumetry of brain regions and helps to characterize the phenotypes of brain structure mutants. Using the VIB protocol does not require any programming skills since all operations are carried out at an intuitively usable graphical user interface. Although the VIB protocol has been developed for the standardization of Drosophila neuroanatomy, the program structure can be used for the standardization of other 3D structures as well.

Conclusion: Standardizing brains and gene expression patterns is a new approach to biological shape and its variability. The VIB protocol provides a first set of tools supporting this endeavor in Drosophila. The script suite is freely available at http://www.neurofly.de2.


Figures
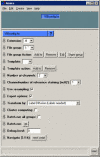
Figure 1
Figure 1
VIBconfig.hx. The configuration script of the VIB protocol in maximum extent. Most of the functions are dispensable for normal standardization. Expert options are implemented for extended automation of the protocol.
Figure 2
Figure 2
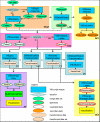
Flowchart of the VIB protocol. The process starts with the import of raw data (upper left). Sections: PREP (light brown): In the steps of preprocessing the imported 3D images are prepared for standardization. These steps include optional resampling and electronic removal of unwanted parts of the 3d images. LAB (light green): During the labeling LabelFields are constructed on the basis of the reference channel; QC1 (light yellow): The first quality control evaluates the LabelFields by basic statistical comparisons of the Material's volumes; RT, LST, CT, DT (light blue): The transformation processes align the Samples to the Template rigidly (RT, LST, CT) or non-rigidly (DT); QC2 (light yellow): The second quality control for the evaluation of the alignment creates MainProbabilityMaps for each file group. These can be controlled visually and statistically; AV (purple): The step of averaging fuses each channel of the 3D images of a file group to an average intensity image. Icons: Ovals: data; squares: processes; diamonds: decisions; hexagon: transformations. Color code: green: 3D images; red: LabelFields; blue: processes/scripts; orange: spreadsheets; yellow: visualization; white: resampled data; hatched: transformed data. Arrows: open: data input to processes; closed: writing data to files.
Figure 3
Figure 3
Registration of two Drosophila brains. Template: blue/green, Sample: orange. A: Template superimposed with untransformed Sample. B: Global rigid transformation applied to the Sample. C: Result of rigid transformation: Sample transferred to Template coordinate system after rigid transformation (VIBcenterTransformation.hx). D: Local rigid transformation for 10 labeled neuropil regions (VIBlabelSurfaceTransformation). For each Material (al: antennal lobe, lob: lobula, lop: lobula plate, med: medulla, mb: mushroom body) the overlap with the corresponding Template Material is maximized without taking the other Materials into account. Thereby as many contradictory rigid transformations are generated as Materials are defined. E: VectorField of non-rigid transformation superimposed. F: non-rigid transformation applied to Sample (VIBdiffusion.hx). G: Result of non-rigid transformation: Template superimposed with transformed Sample. Surrounding boxes outline the data volumes and coordinate systems.
Figure 4
Figure 4
Comparison of Standard Brains created with four different standardization algorithms. Average intensity maps of the pattern channel (line 1+2) display the typical expression pattern of the Gal4 driver line, while average intensity maps of the reference channel (line 3) display the typical morphology of the file group, visualized using the antibody nc82. Brightness is coded in false colors. The difference in fuzziness and the volume of uniformly bright areas can be taken as a measure for alignment quality. MainProbabilityMaps reflect the distribution of the Materials of a file group after transformation (in %). False color coded areas with maximum probability of occurrence of a Material (Material overlaps in all Samples, core) are red, areas outside Materials are blue (see false color scheme). Using the same set of data, one can take the ratio between the core and the area of low probability of occurrence of a Material (seam) as a measure of transformation quality. No MainProbabilityMap is generated for the AmiraRegistrationTransformation because this method does not use LabelFields for the alignment of the Samples but the distribution of the grey values in the 3D images. 1st line: (1a-d): Medial frontal section through a standardized Gal4 expression pattern. The section lies posterior to the horizontal lobes, crosses the tip of the α/α'-lobes (α) the peduncle (p) and the ellipsoid body (e), which is not stained in 201y. 2nd line (2a-d): Direct volume rendering of standardized Gal4 expression patterns. 3rd line (3a-d): Direct Volume Rendering of standardized nc82-reference patterns. 4th line (4b-d): MainProbabilityMap at the same level as 1b-d. The uppermost dots represent the tip of the α/α'-lobes, the dots beneath are cross sections of the mushroom body peduncles. In the optic lobes the section runs through the medulla, the lobula and the very tip of the right lobula plate. Figs. 1-3: Averaged intensities color coded. Figs. 4b-d: Material's probabilities of occurrence color coded. n = 12. Flies: female Gal4-201y × UAS:mcd8GFP.
Figure 5
Figure 5
Comparison of standardized expression patterns. Projection view on standardized expression patterns (ok107/201y/mb247). Gal4 lines were crossed to UAS-EGFP2 for visualization, scanned with a Leica-SP1 confocal microscope (8-bit tifs) and standardized using VIBdiffusionTransformation(DT). On the left the standardized expression patterns are visualized in grey values (Nok107 = 17, N201y/mb247 = 15). On the right the same images are superimposed and color coded (ok107 red, 201y green, mb247 blue). In structures common to all three expression patterns colors add up to white (e.g. γ-lobes of the mushroom body Gal4-positiv in all lines displayed (white), α'/(β') and medial bundle Gal4-positive in ok107 only (red), besides strong Gal4 expression in the pars intercerebralis (PI) in ok107 some cell bodies are Gal4-positive as well in 201y (green)), Scale bar 100 μm
Figure 6
Figure 6
Comparison of interindividual variability in Gal4 expression patterns. Projection view on three individual expression patterns standardized to the same Template. Gal4-NP7088 was crossed to UAS:mcd8GFP. Invariable parts in the distribution of the expression patterns in the central brain (open arrows) easily can be discerned from variable parts as the cell body layer (closed arrows). The resolution and the precision of the transformation are high enough for single cell analysis. Anomalies of single neurons like in Sample 3 (blue) become obvious by this technique (arrowhead). Scale bar 100 μm
Figure 7
Figure 7
Alphabetic index of image file formats supported by Amira (extracted from Amira user's guide). Listed image formats are supported by Amira and therefore can be used with the VIB protocol. The letters in brackets stand for the processing abilities (read, write) of Amira.

References

    1. Amira http://www.amiravis.com
    1. project VIB. http://www.neurofly.de
    1. Brand AH, Perrimon N. Targeted gene expression as a means of altering cell fates and generating dominant phenotypes. Development. 1993;118:401–415. - PubMed
    1. McGuire SE, Le PT, Davis RL. The role of Drosophila mushroom body signaling in olfactory memory. Science. 2001;293:1330–-1333. doi: 10.1126/science.1062622. - DOI - PubMed
    1. Rein K, Zockler M, Heisenberg M. A quantitative three-dimensional model of the Drosophila optic lobes. Curr Biol. 1999;9:93–96. doi: 10.1016/S0960-9822(99)80021-9. - DOI - PubMed

Publication types

LinkOut - more resources