. 2006 Dec 29:7:330.
doi: 10.1186/1471-2164-7-330.

Array-CGH and multipoint FISH to decode complex chromosomal rearrangements

Affiliations

Array-CGH and multipoint FISH to decode complex chromosomal rearrangements

Eva Darai-Ramqvist et al. BMC Genomics. .

Abstract

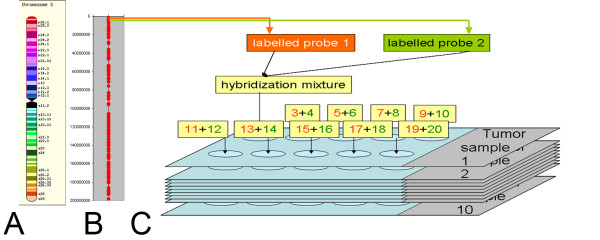
Background: Recently, several high-resolution methods of chromosome analysis have been developed. It is important to compare these methods and to select reliable combinations of techniques to analyze complex chromosomal rearrangements in tumours. In this study we have compared array-CGH (comparative genomic hybridization) and multipoint FISH (mpFISH) for their ability to characterize complex rearrangements on human chromosome 3 (chr3) in tumour cell lines. We have used 179 BAC/PAC clones covering chr3 with an approximately 1 Mb resolution to analyze nine carcinoma lines. Chr3 was chosen for analysis, because of its frequent rearrangements in human solid tumours.

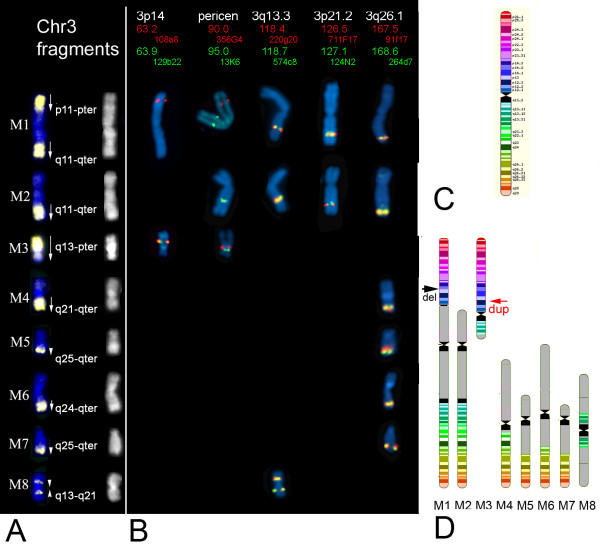
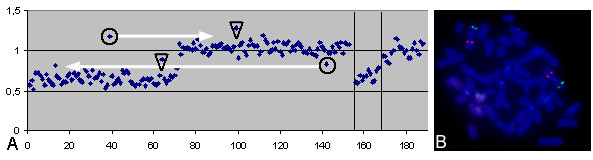
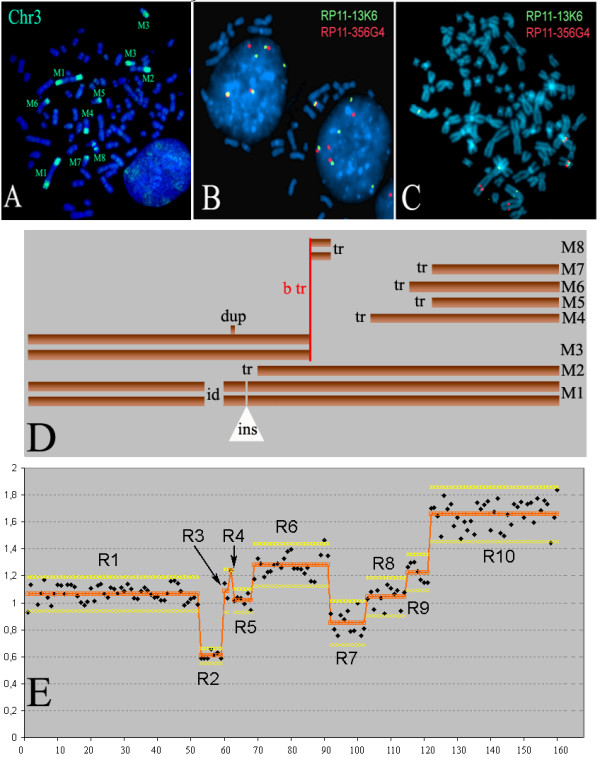
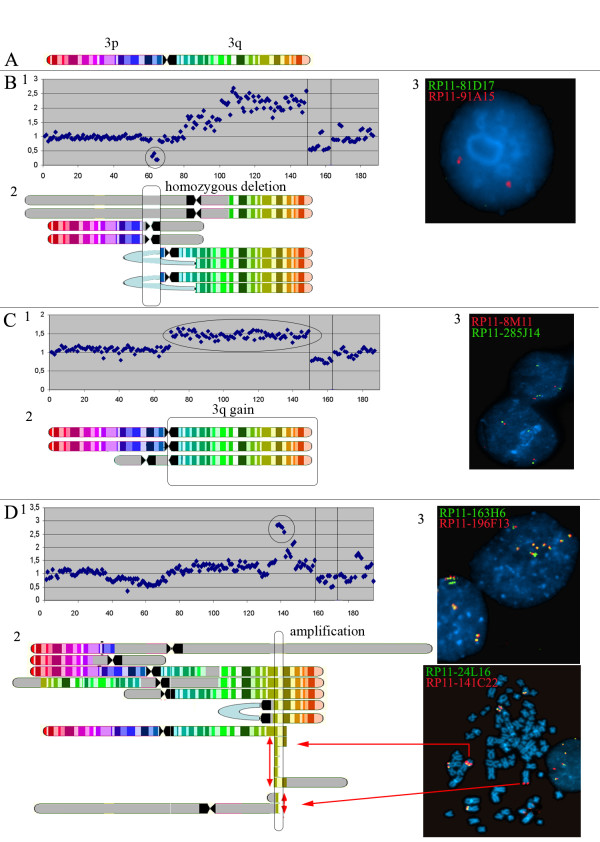
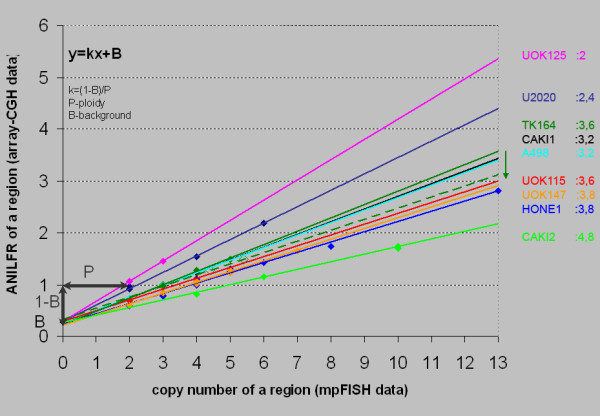
Results: The ploidy of the tumour cell lines ranged from near-diploid to near-pentaploid. Chr3 locus copy number was assessed by interphase and metaphase mpFISH. Totally 53 chr3 fragments were identified having copy numbers from 0 to 14. MpFISH results from the BAC/PAC clones and array-CGH gave mainly corresponding results. Each copy number change on the array profile could be related to a specific chromosome aberration detected by metaphase mpFISH. The analysis of the correlation between real copy number from mpFISH and the average normalized inter-locus fluorescence ratio (ANILFR) value detected by array-CGH demonstrated that copy number is a linear function of parameters that include the variable, ANILFR, and two constants, ploidy and background normalized fluorescence ratio.

Conclusion: In most cases, the changes in copy number seen on array-CGH profiles reflected cumulative chromosome rearrangements. Most of them stemmed from unbalanced translocations. Although our chr3 BAC/PAC array could identify single copy number changes even in pentaploid cells, mpFISH provided a more accurate analysis in the dissection of complex karyotypes at high ploidy levels.


Figures

Figure 1
Figure 1
Chr3 reconstitution in UOK147 based on chromosome painting and mpFISH. A. Chr3 fragments, yellow, are identified by painting on rearranged marker chromosomes (M1, M2....M8). To the right DAPI banding. B. Examples of different mpFISH probe pair (red and green signals) localization on the rearranged chromosomes shown in A. White font on the top line: localization of the used pair on chr3 bands. Red and green fonts: the Mb position and the name of clone having red and green signals respectively. All the clones shown here belong to RP11 BAC library. C. Colour coding of banding pattern on the chr3 ideogram. D. Schematic colour coded representation of chr3 fragments in UOK147 on the rearranged marker chromosomes. Black arrow indicate a deletion site on M1, red arrow shows duplication on M3. Grey parts represent translocation partners from other chromosomes.
Figure 2
Figure 2
Principle of mpFISH. A. Colour coding of banding pattern on the chr3 ideogram. B. Distribution of 179 BAC/PAC sequences along the chr3 (from up to down) according to their base pair position. C. Scheme of mpFISH experimental set up. The BAC/PAC clone DNAs shown in B are labelled pair-wise with either biotin-dUTP(red) or digoxigenin-dUTP (green). 100–200 ng of biotin-labelled and the same amount of digoxygenin-labelled probe was dissolved in 10 μl of hybridization mixture and applied to corresponding area on each slide prepared from the ten different tumour cell line samples (1 μl of mixture containing 10–20 ng of each probe per area/slide). This procedure is repeated for all PAC/BAC probe pairs. Using this set up we were able to obtain FISH the results of 20 probes for ten samples in a single experiment. Hybridisation was carried out for 24–72 hours at 37°C under 9 × 9 mm cover slips sealed with rubber cement. Detection and microscopy are performed as described (see mpFISH technique description in Methods).
Figure 3
Figure 3
Mismapped clones. A. Array-CGH profile of UOK115 cell line. BAC/PACs covering chr3 are displayed in order on the X-axis from telomere of short arm (left), to telomere of long arm (right). Controls derived from chrX are plotted between the vertical lines right to chr3. Controls from autosomes are plotted to the right of the chrX controls. The Y-axis denotes the value of normalized fluorescence ratio (NFR) for each BAC/PAC clone (see Methods). The profile identifies 3p loss with ANILFR ± 1 sd; 0.7 ± 0.07. Two clones highlighted by circles, display outstanding fluorescence ratio than the neighbouring clones. On the plot arrows indicate real localizations revealed by FISH (RP11-129G16 locates at 3q12, clone RP11-732M7 at 3p24-25). Triangles indicate clones, which are part of segmental duplications identified by BLASTN. B. FISH image of normal metaphase with clones: RP11-994B16 (3q21.3), red, and the real localization of RP11-732M7, green, at 3q24-25.
Figure 4
Figure 4
Chr3 rearrangements in UOK147 cell line based on comparison of array-CGH and mpFISH results. A. Chr3 painting probe identifies different chr3 fragments (green) on the rearranged marker chromosomes (M1, M2,...M8).B and C. Interphase (B) and metaphase (C) mpFISH illustration of a pericentromeric rearrangement. Clones RP11-356G4 (red) at 3p11, and RP11-13K6 (green) at 3q11, frame the centromere of chr3. Note the split signal indicating insertion in M1 and loss of red signal indicating loss of 3p through an imbalanced translocation in M2. D. Schematic results of chr3 rearrangements detected by mpFISH. Bars represent chr3 fragments found within the marker chromosomes (M1, M2,...M8). tr: unbalanced translocation breakpoint; b tr: balanced translocation; dup: duplication; id: interstitial deletion; ins: insertion of other chromosome fragment. E. Array-CGH profile. X-axis: displays 179 chr3 BAC clones ordered from 3pter (left) to 3qter (right). Y-axis: normalized fluorescence ratio (NFR). Each spot represents an average between at least two replicas of each clone on the array (see Methods). According to mpFISH we defined specific chr3 regions (R1, R2,...R10) of certain copy number: R1 ANILFR ± 1 sd; 1.07 ± 0.06 corresponds to 4 copies; R2 ANILFR ± 1 sd; 0.61 ± 0.03 corresponds to 2 copies a.s.o (see Table 1). Orange line represents the ANILFR (Average Normalized Inter-Locus Fluorescence Ratio) value and yellow lines frames the double standard deviation intervals for each region (Methods). (see Table 1). (Note: the measurement points from individual PAC/BAC clones, which reside outside the double standard deviation, must be confirmed by FISH to be able to rely on them. In this case FISH confirmed only one single clone change -R4).
Figure 5
Figure 5
Array-CGH profiles and mpFISH of three cancer cell lines displaying different chr3 aberrations. A. Colour coding of banding pattern on the chr3 ideogram. B. Detection of homozygous deletion at 3p12-p13 in U2020. B1. Array-CGH detection of homozygous deletion (circle on the plot) (ANILFR ± 1 sd; 0.28 ± 0.1 as shown in Table 1). See for chart description legend to Fig 3. B2. Schematic representation of chr3 segments on the rearranged chromosomes according to mpFISH results. Grey parts represent translocation partners from other chromosomes. Blue loops show fusion between fragments. Rectangle box marks the chr3 region, corresponding to a homozygous deletion (0 copy number), missing in all rearranged chromosomes. Each piece from chr3 corresponds to the colour code given in A. B3. Interphase mpFISH visualizing the homozygous deletion. Probes RP11-91A15 (red) and RP11-81D17 (green) represent the region 3p11 outside and 3p12.2 within homozygous deletion, respectively. C. Terminal 3q gain in UOK125 using array-CGH (ANILFR ± 1 sd; 1.46 ± 0.08) (C1), metaphase mpFISH (C2) and interphase mpFISH (C3) (3 copies of 3q). The general layout follows the structure described for Fig 5B highlighting 3q gain of 3 copy number. On C3 RP11-8M11 (2 red signals on each nucleus) and RP11-285J14 (3 green signals on each nucleus) are located at 3p12.1 and 3q11.2 respectively. D. Amplification at 3q26 in HONE1 detected by array-CGH (ANILFR ± 1 sd; 2.81 ± 0.05) (D1), metaphase mpFISH (D2) and interphase mpFISH (D3) (13 copies). The general layout follows the structure described for Fig 5B. Arrows on D2 indicate duplication cycles within the amplified region. Interphase FISH image shows higher amplification of region at 173.25 Mb (RP11-163H6; green signals) compared to region at 173.65 Mb (RP11-196F13; red) within 3q26.31. On metaphase mpFISH image red signal corresponds to RP11-141C22 at 170.36 Mb, green signal corresponds to RP11-24L16 at 169.69 Mb within 3q26.2. Red arrows show amplified loci on rearranged chromosomes corresponding to our schematic representation on D2.
Figure 6
Figure 6
Correlation between ANILFR (Average Normalized Inter-Locus Fluorescence Ratio) value identified by array-CGH and copy number determined by mpFISH. X-axis: copy number of chr3 regions (R1, R2...) identified by interphase and/or metaphase mpFISH (see "Copy nr FISH" in table 1). Y-axis: ANILFR value for the same regions (see ANILFR in Table 1). As example for UOK125 cell line: Region R1, has an ANILFR of 1.07 (Y-axis value), which corresponds to 2 copies of this region on chr3 (X- axis value). (see Figure 5C and Table 1). These (x, y) coordinates define the first data point (pink romb) for the UOK125 trend line. The second data point corresponds to R2 with ANILFR of 1.46 (Y-axis value), and with a copy number of 3 (X- axis value). Each cell line has a number of data points (rombs of respective colour) corresponding to the number of chr3 region of different copy number (Table 1 – Region). Trend lines for each cell line were calculated and drawn. The interception of trend lines on Y-axis indicates the intensity of the background fluorescence "B" (corresponding to 0 copies, homozygous deletion region in U2020, ANILFR of 0.28). The slope of the trend lines reflects ploidy level. At the right from the graph, the ploidy number obtained from chromosome counts is shown for the respective cell lines ("Ploidy C" on Table 1). See other explanations in the text.

Similar articles

Cited by

References

    1. Van Prooijen-Knegt AC, Van Hoek JF, Bauman JG, Van Duijn P, Wool IG, Van der Ploeg M. In situ hybridization of DNA sequences in human metaphase chromosomes visualized by an indirect fluorescent immunocytochemical procedure. Exp Cell Res. 1982;141:397–407. doi: 10.1016/0014-4827(82)90228-2. - DOI - PubMed
    1. Kallioniemi A, Kallioniemi OP, Sudar D, Rutovitz D, Gray JW, Waldman F, Pinkel D. Comparative genomic hybridization for molecular cytogenetic analysis of solid tumors. Science. 1992;258:818–821. doi: 10.1126/science.1359641. - DOI - PubMed
    1. Pinkel D, Segraves R, Sudar D, Clark S, Poole I, Kowbel D, Collins C, Kuo WL, Chen C, Zhai Y, Dairkee SH, Ljung BM, Gray JW, Albertson DG. High resolution analysis of DNA copy number variation using comparative genomic hybridization to microarrays. Nat Genet. 1998;20:207–211. doi: 10.1038/2524. - DOI - PubMed
    1. Oostlander AE, Meijer GA, Ylstra B. Microarray-based comparative genomic hybridization and its applications in human genetics. Clin Genet. 2004;66:488–495. doi: 10.1111/j.1399-0004.2004.00322.x. - DOI - PubMed
    1. Furuya T, Uchiyama T, Adachi A, Chochi Y, Oga A, Kawauchi S, Ishiglo K, Sasaki K. Relation of DNA ploidy to genetic aberrations detected by chromosomal CGH and FISH in gastric adenocarcinomas. Oncol Rep. 2006;15:1491–1496. - PubMed

Publication types

LinkOut - more resources