

Magnetic resonance lactate and lipid signals in rat brain after middle cerebral artery occlusion model
- PMID: 17196558
- PMCID: PMC2605392
- DOI: 10.1016/j.brainres.2006.11.075
Magnetic resonance lactate and lipid signals in rat brain after middle cerebral artery occlusion model
Abstract
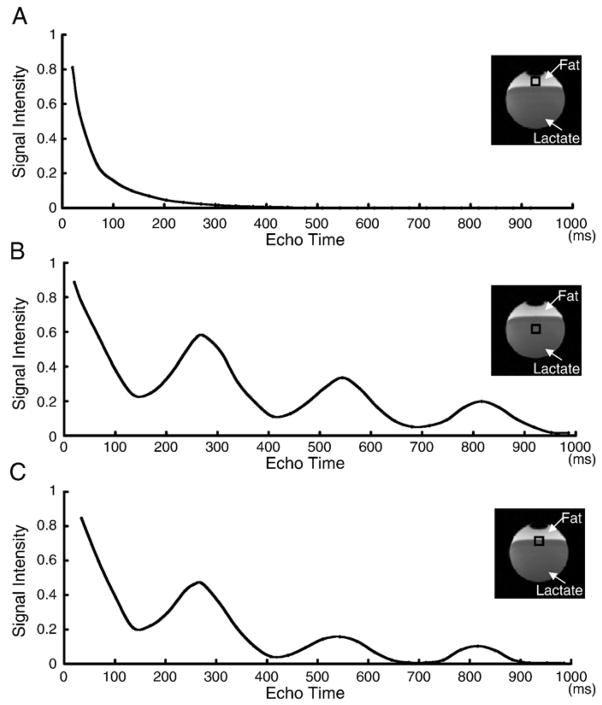
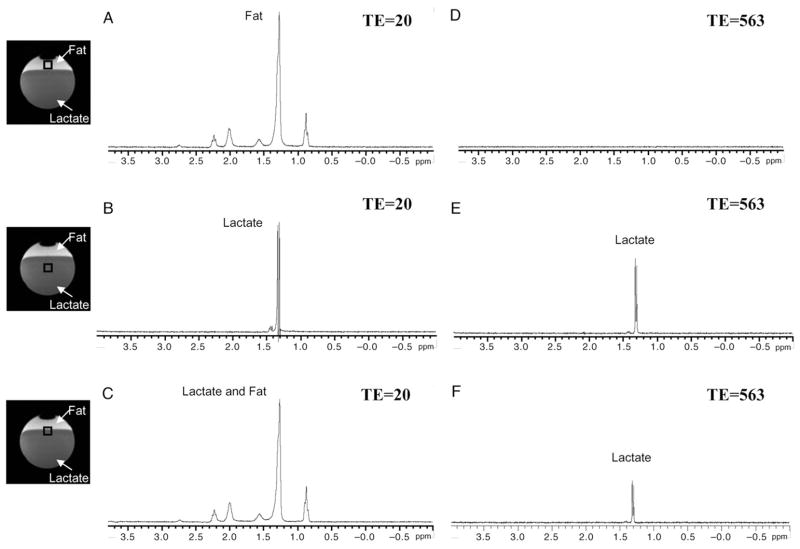
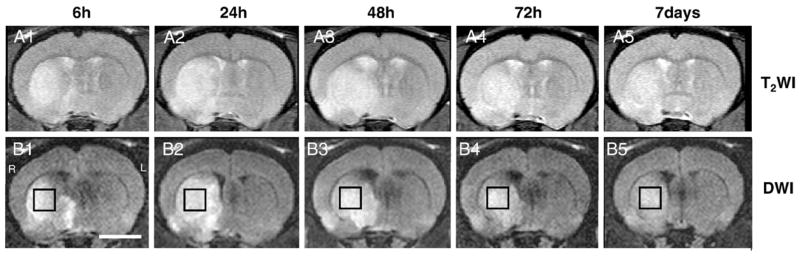
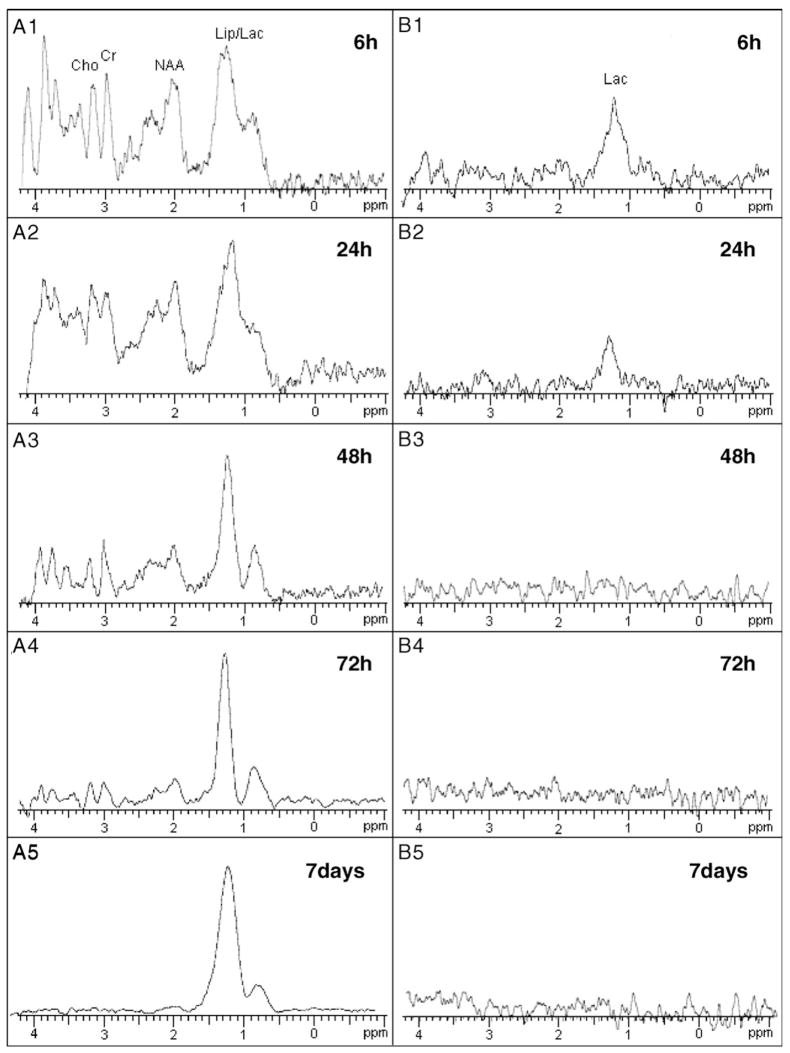
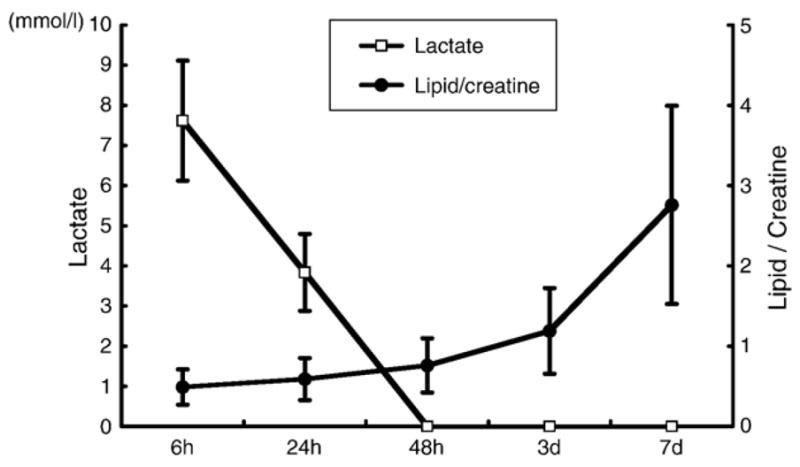
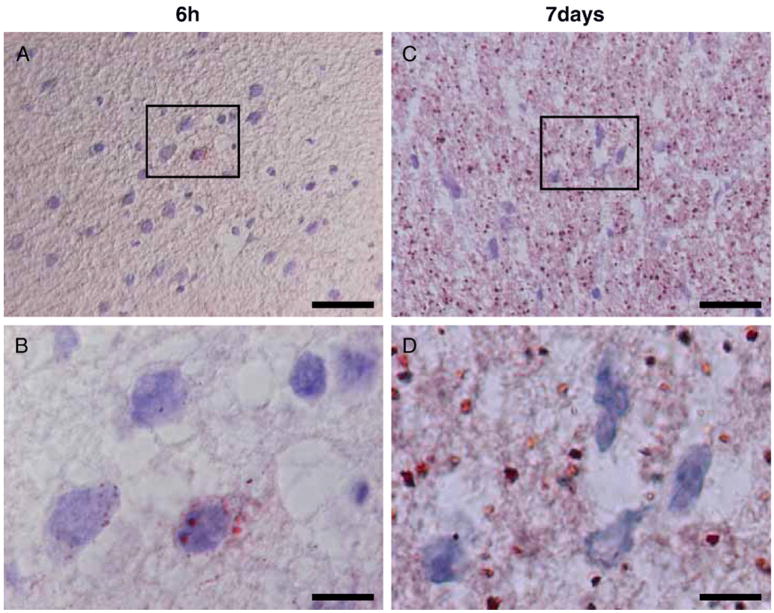
Proton magnetic resonance spectroscopy (1-H MRS) has revealed changes of metabolites in acute cerebral infarction. Although the drastic changes of lactate and N-acetyl-aspartate have been reported to be useful indicators of the ischemic damage in both humans and experimental animals, lipid signals are also detected by the short echo time sequence 1-5 days after ischemia. The objective of this study was to find a novel technique to isolate lactate signals from lipid signals in the ischemic brain. First, MRS was used to study the lipid and lactate components of a spherical phantom in vitro, and parameters were established to separate these components in vitro. Then, MR measurements were obtained from the brains of middle cerebral artery occlusion rats. All MR measurements were performed using a 7-T (300 MHz), 18.3-cm-bore superconducting magnet (Oxford Magnet Technologies) interfaced to a Unity INOVA Imaging System (Varian Technologies). T2-weighted images were obtained from a 1.0-mm-thick coronal section using a 3-cm field of view. It is well known that lipid has a shorter and lactate a longer T2 relaxation time. These distinct magnetic characteristics allowed us to separate the lactate signal from the lipid signal. Thus, adjustment of the echo time is essential to analyze the metabolites in acute cerebral infarction, which may be useful in both the clinic and laboratory.
Figures
Similar articles
-
Correlation between lactate and neuronal cell damage in the rat brain after focal ischemia: An in vivo 1H magnetic resonance spectroscopic (1H-MRS) study.Acta Radiol. 2010 Apr;51(3):344-50. doi: 10.3109/02841850903515395. Acta Radiol. 2010. PMID: 20144147
-
Middle cerebral artery occlusion during MR-imaging: investigation of the hyperacute phase of stroke using a new in-bore occlusion model in rats.Brain Res Brain Res Protoc. 2004 Feb;12(3):137-43. doi: 10.1016/j.brainresprot.2003.08.006. Brain Res Brain Res Protoc. 2004. PMID: 15013464
-
Continuing ischemic damage after acute middle cerebral artery infarction in humans demonstrated by short-echo proton spectroscopy.Stroke. 1995 Jun;26(6):1007-13. doi: 10.1161/01.str.26.6.1007. Stroke. 1995. PMID: 7762015
-
Early metabolic changes following ischemia onset in rats: an in vivo diffusion-weighted imaging and 1H-magnetic resonance spectroscopy study at 7.0 T.Mol Med Rep. 2015 Jun;11(6):4109-14. doi: 10.3892/mmr.2015.3283. Epub 2015 Jan 30. Mol Med Rep. 2015. PMID: 25634261 Free PMC article.
-
[Clinical application of 1H nuclear magnetic resonance spectroscopy into patients with cerebral ischemia].Hokkaido Igaku Zasshi. 1998 Nov;73(6):581-97. Hokkaido Igaku Zasshi. 1998. PMID: 10036616 Clinical Trial. Japanese.
Cited by
-
Amide proton transfer-weighted MRI can detect tissue acidosis and monitor recovery in a transient middle cerebral artery occlusion model compared with a permanent occlusion model in rats.Eur Radiol. 2019 Aug;29(8):4096-4104. doi: 10.1007/s00330-018-5964-3. Epub 2019 Jan 21. Eur Radiol. 2019. PMID: 30666450
-
Neuroprotection of Stem Cells Against Ischemic Brain Injury: From Bench to Clinic.Transl Stroke Res. 2024 Aug;15(4):691-713. doi: 10.1007/s12975-023-01163-3. Epub 2023 Jul 7. Transl Stroke Res. 2024. PMID: 37415004 Free PMC article. Review.
-
Exogenous carbon monoxide protects against mitochondrial DNA‑induced hippocampal pyroptosis in a model of hemorrhagic shock and resuscitation.Int J Mol Med. 2020 Apr;45(4):1176-1186. doi: 10.3892/ijmm.2020.4493. Epub 2020 Feb 7. Int J Mol Med. 2020. PMID: 32124959 Free PMC article.
-
Magnetic resonance characterization of ischemic tissue metabolism.Open Neuroimag J. 2011;5:66-73. doi: 10.2174/1874440001105010066. Epub 2011 Nov 4. Open Neuroimag J. 2011. PMID: 22216079 Free PMC article.
-
Quantitative proton spectroscopic imaging of the neurochemical profile in rat brain with microliter resolution at ultra-short echo times.Magn Reson Med. 2008 Jan;59(1):52-8. doi: 10.1002/mrm.21447. Magn Reson Med. 2008. PMID: 18050343 Free PMC article.
References
-
- Abe K, Yoshimura H, Tanaka H, Fujita N, Hikita T, Sakoda S. Comparison of conventional and diffusion-weighted MRI and proton MR spectroscopy in patients with mitochondrial encephalomyopathy, lactic acidosis, and stroke-like events. Neuroradiology. 2004;46(2):113–117. - PubMed
-
- Bottomley PA. Spatial localization in NMR spectroscopy in vivo. Ann N Y Acad Sci. 1987;508:333–348. - PubMed
-
- Brierley JB, Brown AW. The origin of lipid phagocytes in the central nervous system: I. The intrinsic microglia. J Comp Neurol. 1982;211(4):397–406. - PubMed
-
- Bruhn H, Frahm J, Gyngell ML, Merboldt KD, Hanicke W, Sauter R. Cerebral metabolism in man after acute stroke: new observations using localized proton NMR spectroscopy. Magn Reson Med. 1989;9(1):126–131. - PubMed
-
- Duijn JH, Matson GB, Maudsley AA, Hugg JW, Weiner MW. Human brain infarction: proton MR spectroscopy. Radiology. 1992;183(3):711–718. - PubMed
Publication types
MeSH terms
Substances
Grants and funding
LinkOut - more resources
Full Text Sources
