

A statistical methodology for analyzing co-occurrence data from a large sample
- PMID: 17197246
- PMCID: PMC2041889
- DOI: 10.1016/j.jbi.2006.11.003
A statistical methodology for analyzing co-occurrence data from a large sample
Abstract
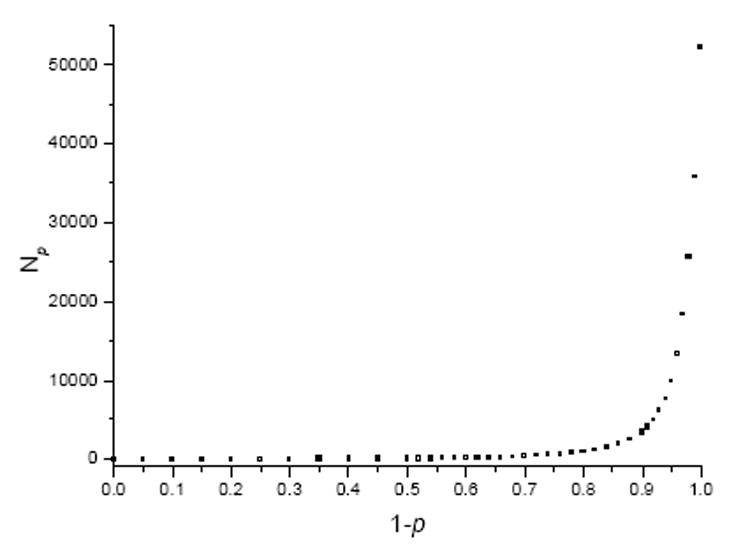
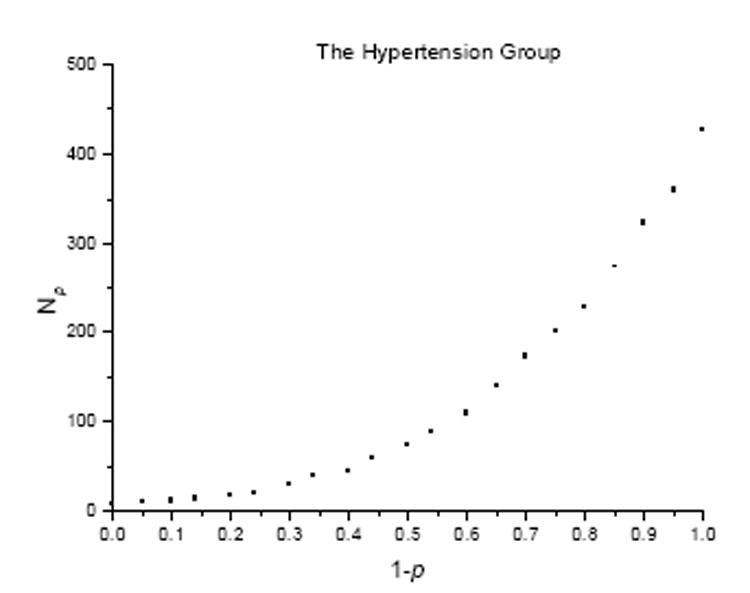
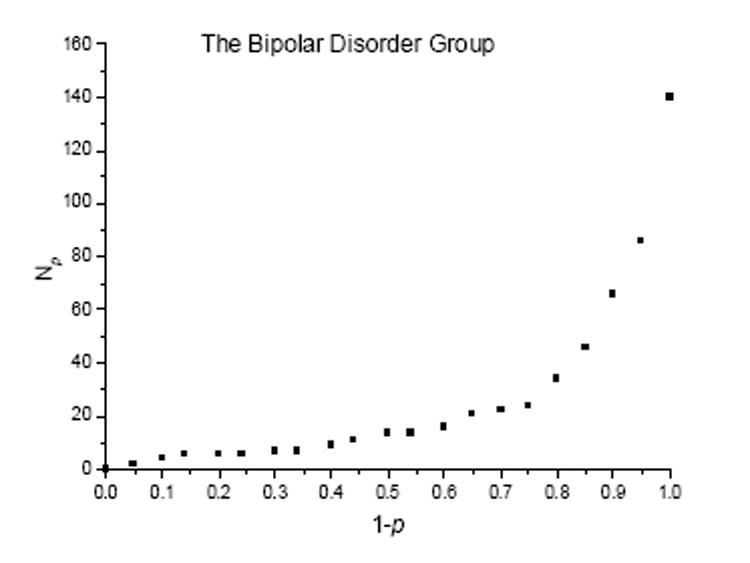
Determining important associations among items in a large database is challenging due to multiple simultaneous hypotheses and the ability to select weak associations that are statistically but not clinically significant. The simple application of the chi2 test among all possible pairs of items results in mostly inappropriate associations surpassing the traditional (alpha=.05, chi2=3.94) threshold. One can choose a stricter threshold to find stronger associations, but the choice may be arbitrary. We combined the volume test of Diaconis and Efron with a p-value plot to select a more rigorous and less arbitrary threshold. The volume test adjusts the p-value of the chi2-statistic. A plot of adjusted p-values (1 - p versus N(p)), where N(p) is the number of test statistics with a p-value greater than p, should be linear if there are no true associations. The point where the plot deviates from a line can be used as a threshold. We used linear regression to select the threshold in a reproducible fashion. In one experiment, we found that the method selected a threshold similar to that previously obtained by manually reviewing associations.
Figures


Similar articles
-
Beyond eyeballing: fitting models to experimental data.Crit Rev Biochem Mol Biol. 2000;35(5):359-91. doi: 10.1080/10409230091169212. Crit Rev Biochem Mol Biol. 2000. PMID: 11099051 Review. No abstract available.
-
Folic acid supplementation and malaria susceptibility and severity among people taking antifolate antimalarial drugs in endemic areas.Cochrane Database Syst Rev. 2022 Feb 1;2(2022):CD014217. doi: 10.1002/14651858.CD014217. Cochrane Database Syst Rev. 2022. PMID: 36321557 Free PMC article.
-
Mining a clinical data warehouse to discover disease-finding associations using co-occurrence statistics.AMIA Annu Symp Proc. 2005;2005:106-10. AMIA Annu Symp Proc. 2005. PMID: 16779011 Free PMC article.
-
Trimmed weighted Simes' test for two one-sided hypotheses with arbitrarily correlated test statistics.Biom J. 2009 Dec;51(6):885-98. doi: 10.1002/bimj.200900132. Biom J. 2009. PMID: 20014203
-
Split-plot microarray experiments: issues of design, power and sample size.Appl Bioinformatics. 2005;4(3):187-94. doi: 10.2165/00822942-200504030-00003. Appl Bioinformatics. 2005. PMID: 16231960
Cited by
-
Using classification models for the generation of disease-specific medications from biomedical literature and clinical data repository.J Biomed Inform. 2017 May;69:259-266. doi: 10.1016/j.jbi.2017.04.014. Epub 2017 Apr 20. J Biomed Inform. 2017. PMID: 28435015 Free PMC article.
-
Detection of practice pattern trends through Natural Language Processing of clinical narratives and biomedical literature.AMIA Annu Symp Proc. 2007 Oct 11;2007:120-4. AMIA Annu Symp Proc. 2007. PMID: 18693810 Free PMC article.
-
Automated acquisition of disease drug knowledge from biomedical and clinical documents: an initial study.J Am Med Inform Assoc. 2008 Jan-Feb;15(1):87-98. doi: 10.1197/jamia.M2401. Epub 2007 Oct 18. J Am Med Inform Assoc. 2008. PMID: 17947625 Free PMC article.
-
Selecting information in electronic health records for knowledge acquisition.J Biomed Inform. 2010 Aug;43(4):595-601. doi: 10.1016/j.jbi.2010.03.011. Epub 2010 Mar 31. J Biomed Inform. 2010. PMID: 20362071 Free PMC article.
-
Modeling temporal relationships in large scale clinical associations.J Am Med Inform Assoc. 2013 Mar-Apr;20(2):332-41. doi: 10.1136/amiajnl-2012-001117. Epub 2012 Sep 27. J Am Med Inform Assoc. 2013. PMID: 23019240 Free PMC article.
References
-
- Efron B. Large-scale simultaneous hypothesis testing: The choice of a null hypothesis. J Amer Statist Assoc. 2004;99:96–104.
-
- Yates F. Contingency table involving small numbers and the χ2 test. Journal of the Royal Statistical Society (Supplement) 1934;1:217–235.
-
- Diaconis P, Efron B. Testing for independence in a two-way table. Annals of Statistics. 1985;13:845–874.
-
- Lindsay BG, Markatou M. Statistical Distances: A Global Framework to Inference. Springer Series in Statistics. in press.
Publication types
MeSH terms
Grants and funding
LinkOut - more resources
Full Text Sources
Medical
Miscellaneous
