. 2007 Jan 9;104(2):543-8.
doi: 10.1073/pnas.0606078104. Epub 2006 Dec 29.

Contingent Pacific-Atlantic Ocean influence on multicentury wildfire synchrony over western North America

Affiliations

Contingent Pacific-Atlantic Ocean influence on multicentury wildfire synchrony over western North America

Thomas Kitzberger et al. Proc Natl Acad Sci U S A. .

Abstract

Widespread synchronous wildfires driven by climatic variation, such as those that swept western North America during 1996, 2000, and 2002, can result in major environmental and societal impacts. Understanding relationships between continental-scale patterns of drought and modes of sea surface temperatures (SSTs) such as El Niño-Southern Oscillation (ENSO), Pacific Decadal Oscillation (PDO), and Atlantic Multidecadal Oscillation (AMO) may explain how interannual to multidecadal variability in SSTs drives fire at continental scales. We used local wildfire chronologies reconstructed from fire scars on tree rings across western North America and independent reconstructions of SST developed from tree-ring widths at other sites to examine the relationships of multicentury patterns of climate and fire synchrony. From 33,039 annually resolved fire-scar dates at 238 sites (the largest paleofire record yet assembled), we examined forest fires at regional and subcontinental scales. Since 1550 CE, drought and forest fires covaried across the West, but in a manner contingent on SST modes. During certain phases of ENSO and PDO, fire was synchronous within broad subregions and sometimes asynchronous among those regions. In contrast, fires were most commonly synchronous across the West during warm phases of the AMO. ENSO and PDO were the main drivers of high-frequency variation in fire (interannual to decadal), whereas the AMO conditionally changed the strength and spatial influence of ENSO and PDO on wildfire occurrence at multidecadal scales. A current warming trend in AMO suggests that we may expect an increase in widespread, synchronous fires across the western U.S. in coming decades.


Conflict of interest statement

The authors declare no conflict of interest.

Figures

Fig. 1.
Fig. 1.
Loadings of the first two PCs of a rotated principal components analysis of percentage of sites with fire scars (%SF) plotted in PC1–2 space.
Fig. 2.
Fig. 2.
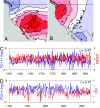
Spatial and temporal patterns of fire correlations with PDSI and SST indices. (A and B) Correlations between the scores of the first two components of a rotated principal components analysis (PCA) of percentage sites with fire scars (%SF) and gridded tree-ring reconstructed PDSI in the conterminous U.S. for the period 1550–1925. Scores from the first two components of a varimax rotated PCA of the %SF (log scale, blue). (C and D) Superimposed on PC1 and PC2 scores are reconstructed NINO3 and reconstructed PDO (red line).
Fig. 3.
Fig. 3.
Indices of fire synchrony (50-year moving correlations between selected regions, black line) compared with a 10-year spline of reconstructed AMO (blue line). Light blue and light red shaded areas indicate periods of low and high AMO, respectively, as defined by intervention analysis (19). Synchrony index was computed as the mean of all pairwise 50-year running correlations of %SF for all region pairs and reflects overall fire synchrony. Dipole Index was computed as the mean of all pairwise 50-year running correlations between the %SF of the Pacific Northwest and combined Southwest regions (AZ, SNM, NNM, and SCO) and reflects the degree of synchrony or asynchrony along the north–south dipole.
Fig. 4.
Fig. 4.
Correlations between the fire synchrony index (A), the dipole fire index (B), and the 49-year running mean AMO (C) with a time-smoothed version (49-running mean) of gridded tree-ring reconstructed PDSI for the period 1574–1899.
Fig. 5.
Fig. 5.
Rotated principal components analysis of percentage of sites with fire scars (%SF) by region performed separately for AMO-positive (A–C), AMO-negative (D–F), and AMO-neutral periods (G–I) as defined by intervention analysis (19). (A, B, D, E, G, and H) Correlations between the scores of the first two components of a rotated principal components analysis and tree-ring reconstructed PDSI grid. (C, F, and I) Loadings of the first two principal components of the rotated principal components analysis of %SF.

References

    1. McCabe GJ, Palecki MA, Betancourt JL. Proc Natl Acad Sci U.S.A. 2004;101:4136–4141. - PMC - PubMed
    1. Hidalgo HG. Water Resource Res. 2004;40:W12504.
    1. Schubert SD, Suarez MJ, Pegion PJ, Koster RD, Bacmeister JT. Science. 2004;303:1855–1859. - PubMed
    1. Seager R, Kushnir Y, Herweijer C, Naik N, Velez J. J Clim. 2005;18:4065–4088.
    1. Sutton RT, Hodson DLR. Science. 2005;309:115–118. - PubMed

LinkOut - more resources