. 2007 Jan 9;46(1):106-19.
doi: 10.1021/bi061944p.

Mechanism of interactions of alpha-naphthoflavone with cytochrome P450 3A4 explored with an engineered enzyme bearing a fluorescent probe

Affiliations

Mechanism of interactions of alpha-naphthoflavone with cytochrome P450 3A4 explored with an engineered enzyme bearing a fluorescent probe

Tamara N Tsalkova et al. Biochemistry. .

Abstract

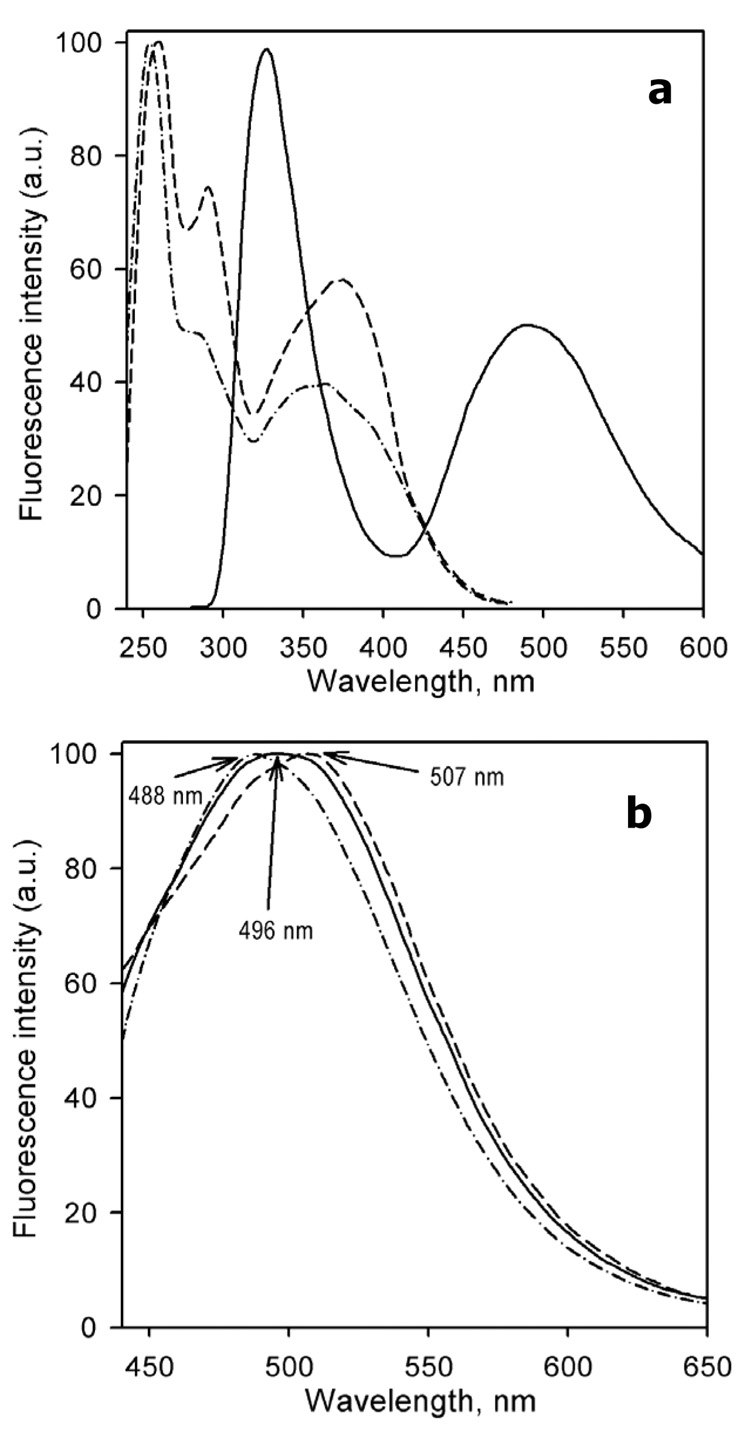
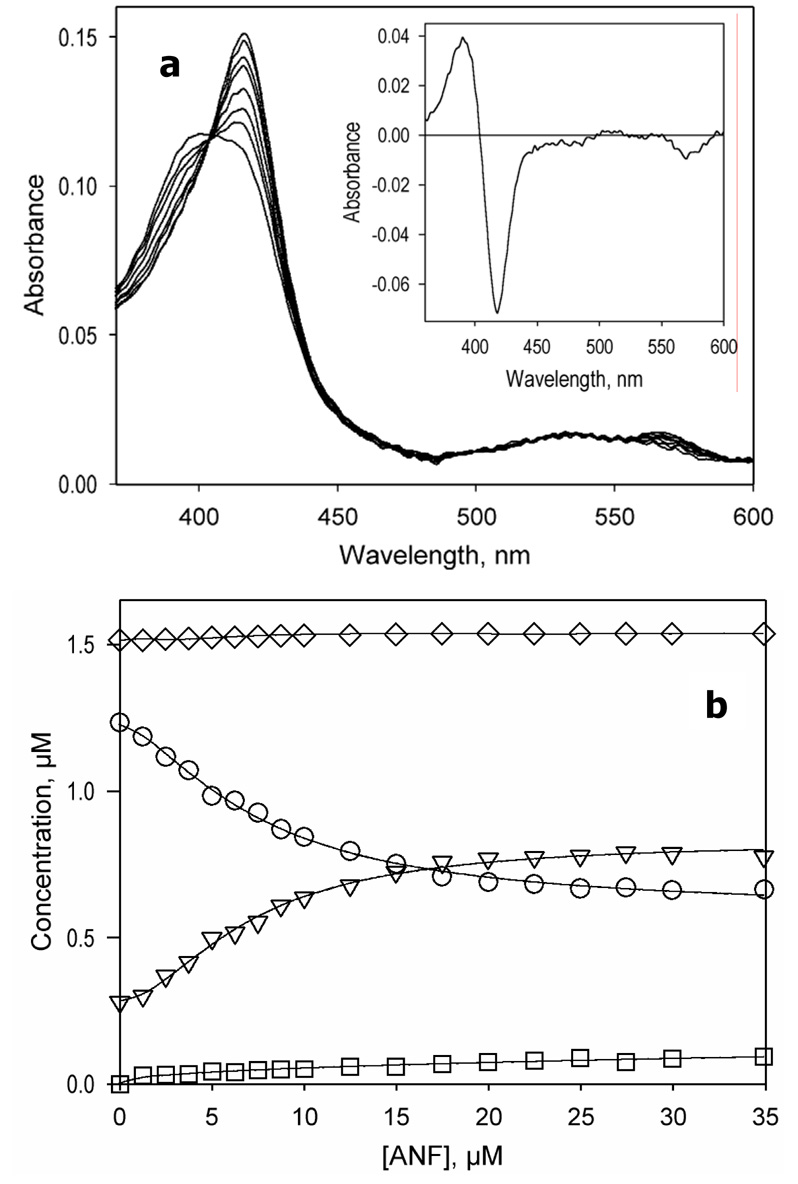
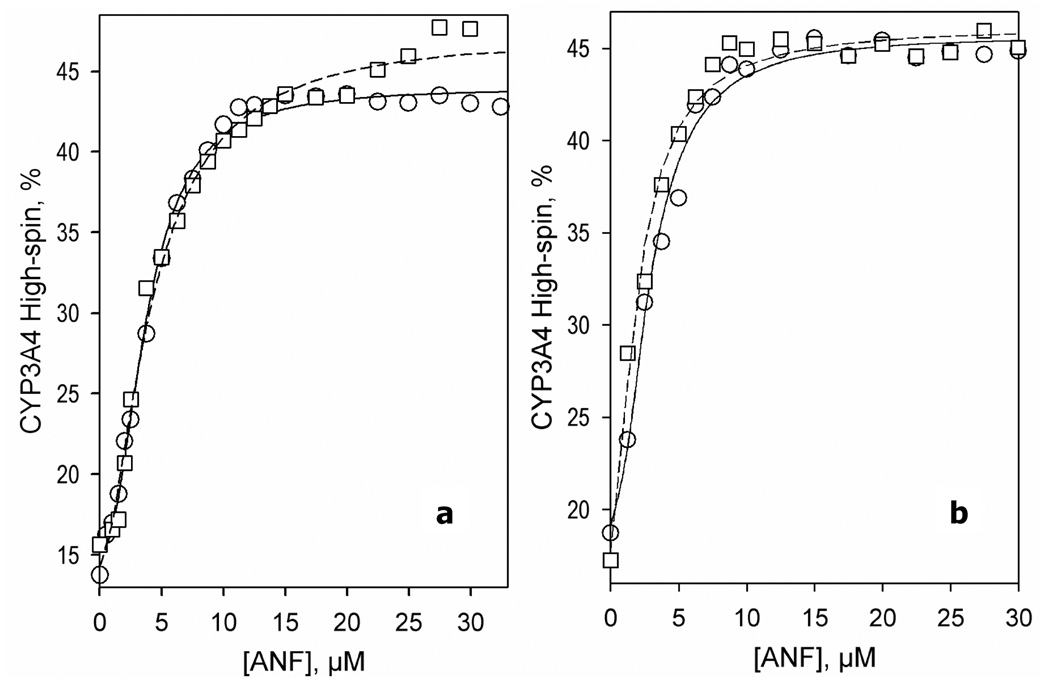
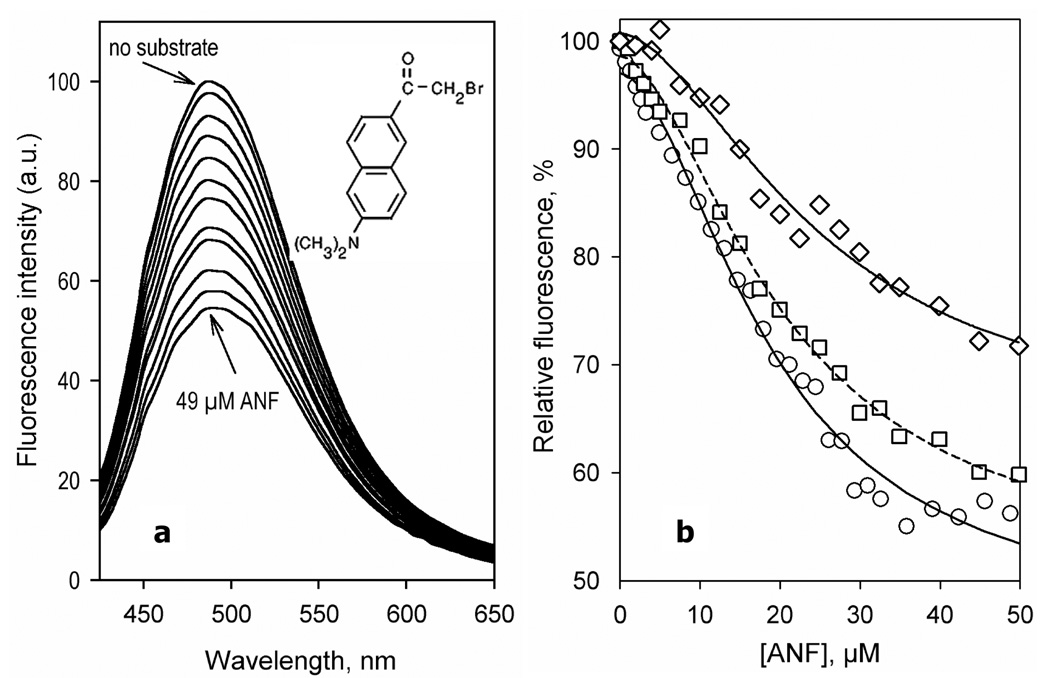
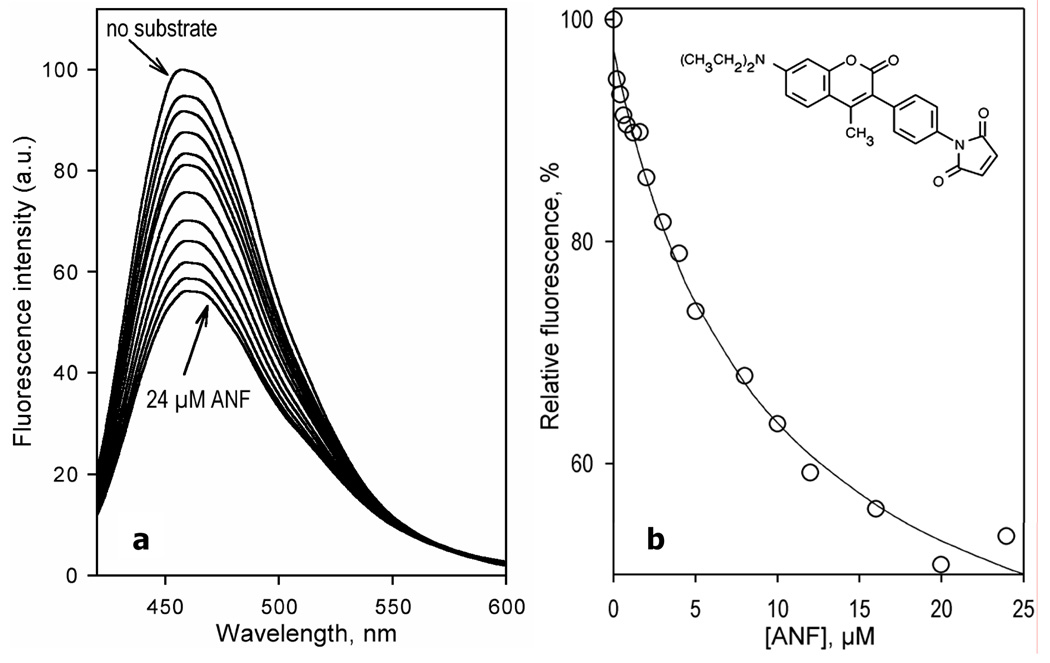
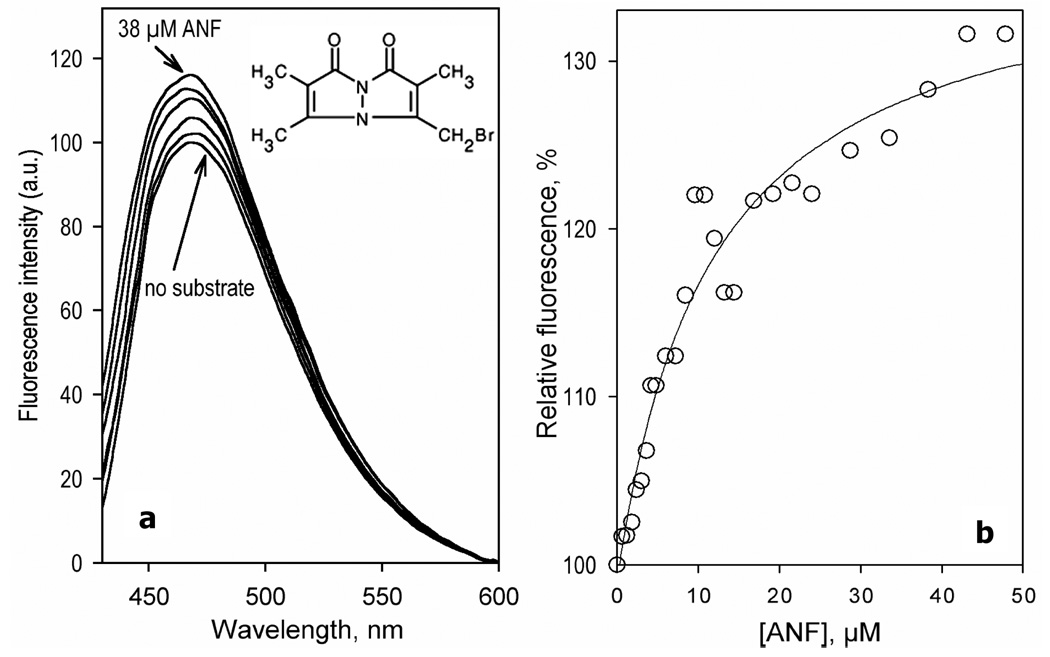
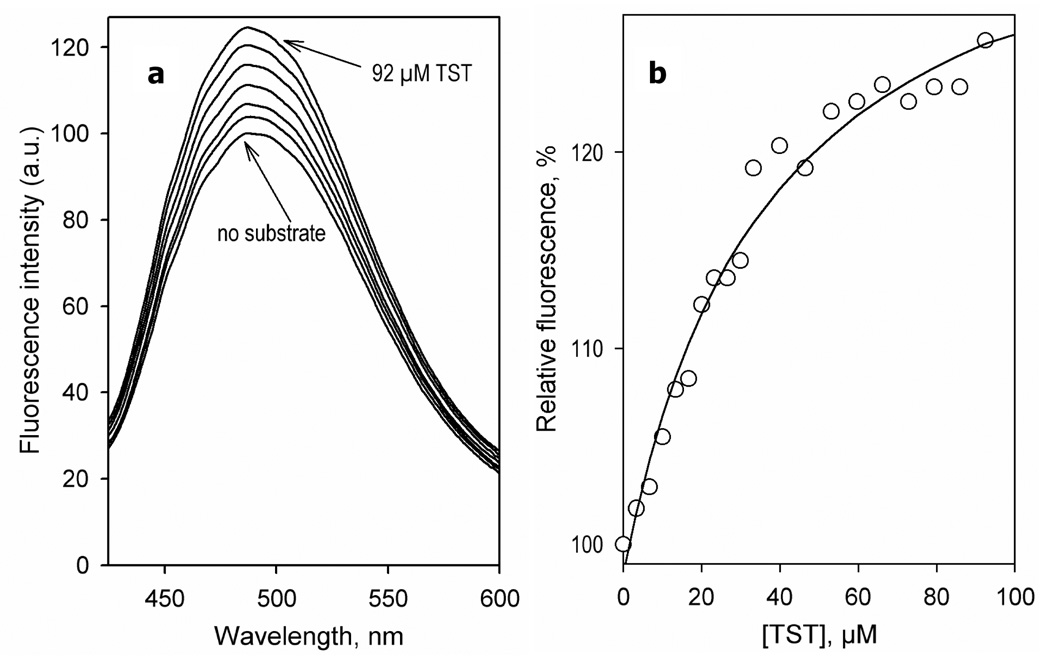
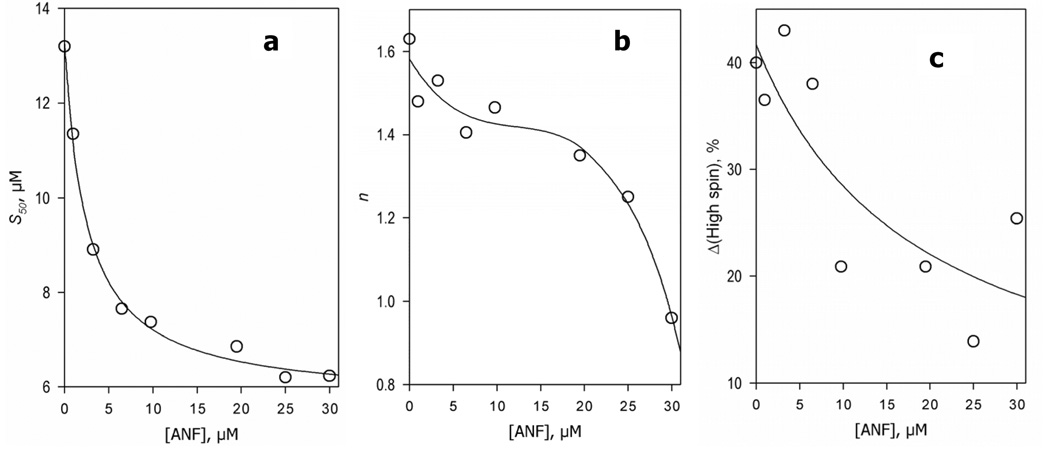
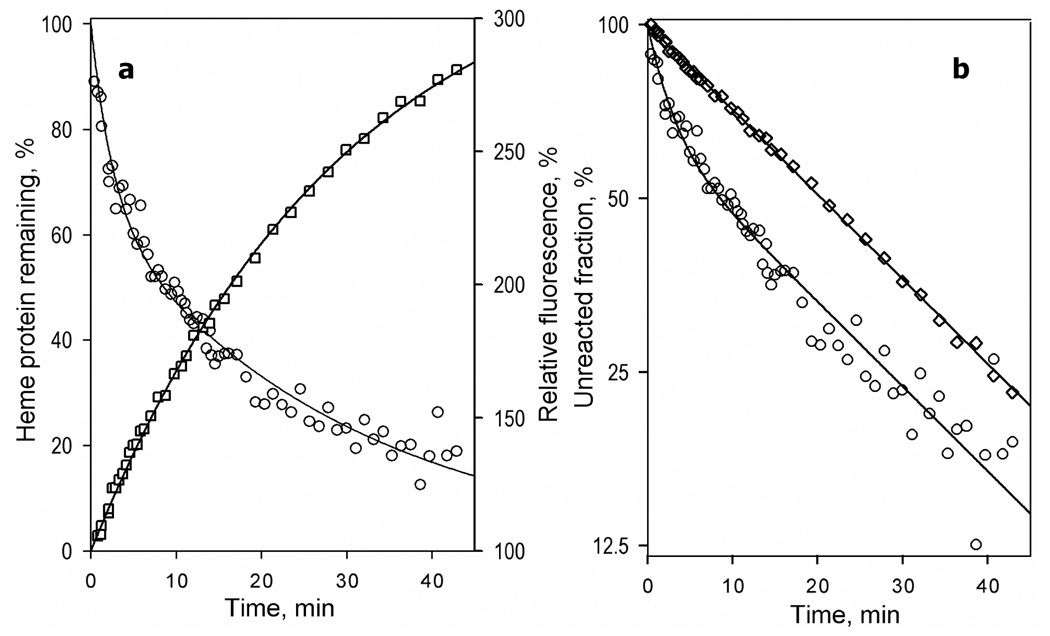
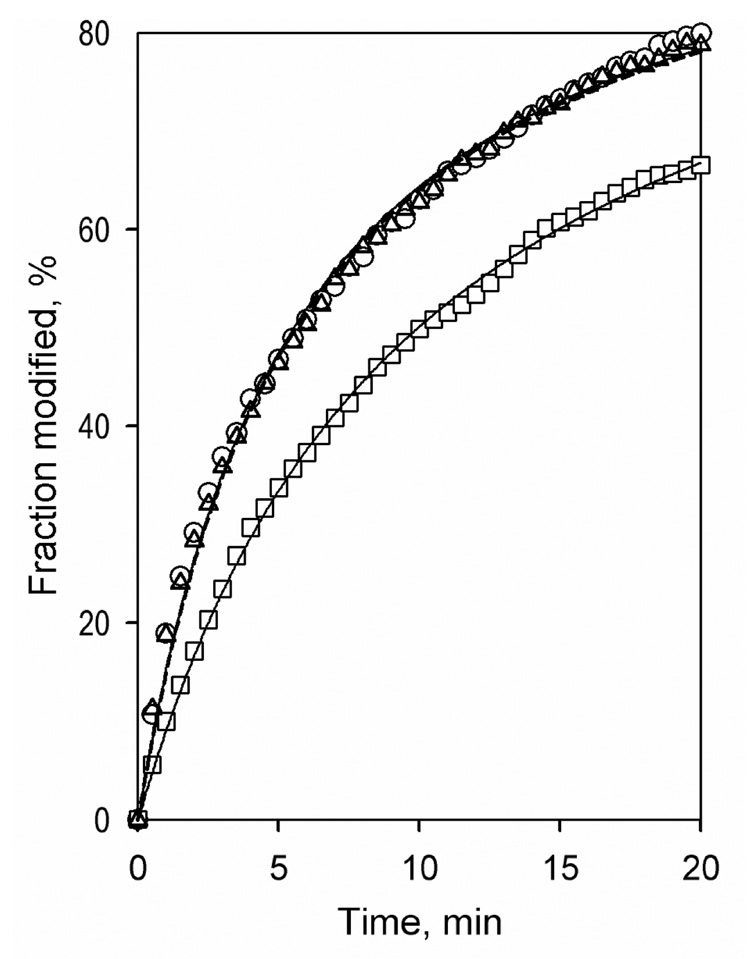
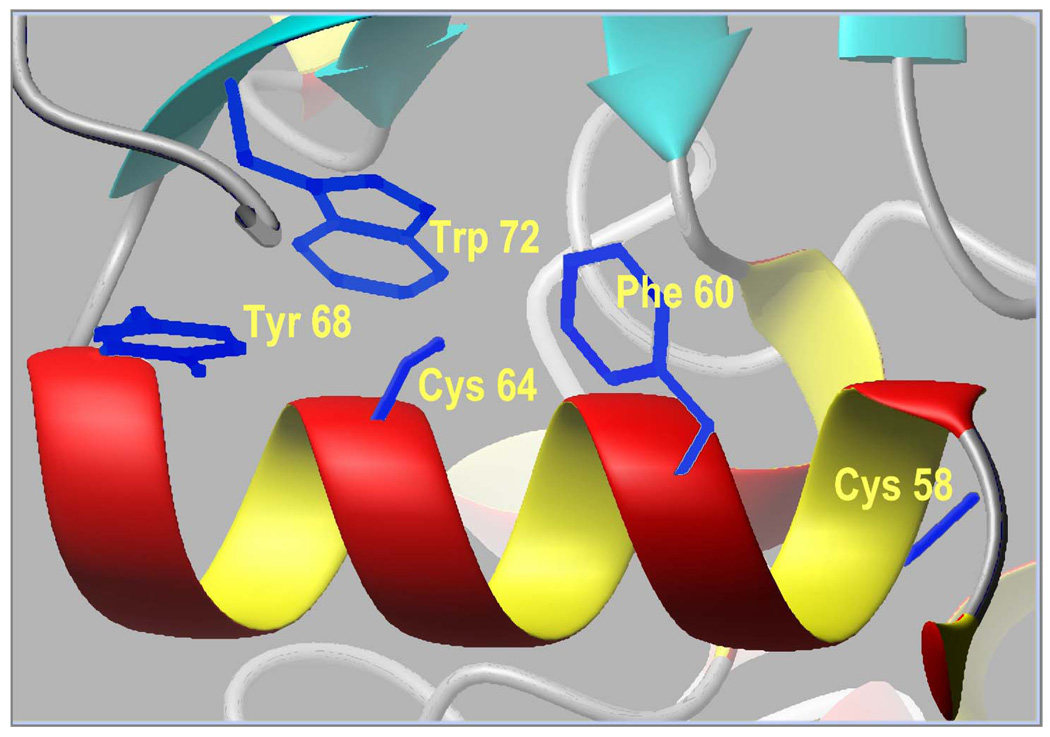
Design of a partially cysteine-depleted C98S/C239S/C377S/C468A cytochrome P450 3A4 mutant designated CYP3A4(C58,C64) allowed site-directed incorporation of thiol-reactive fluorescent probes into alpha-helix A. The site of modification was identified as Cys-64 with the help of CYP3A4(C58) and CYP3A4(C64), each bearing only one accessible cysteine. Changes in the fluorescence of CYP3A4(C58,C64) labeled with 6-(bromoacetyl)-2-(dimethylamino)naphthalene (BADAN), 7-(diethylamino)-3-(4'-maleimidylphenyl)-4-methylcoumarin (CPM), or monobromobimane (mBBr) were used to study the interactions with bromocriptine (BCT), 1-pyrenebutanol (1-PB), testosterone (TST), and alpha-naphthoflavone (ANF). Of these substrates only ANF has a specific effect, causing a considerable decrease in fluorescence intensity of BADAN and CPM and increasing the fluorescence of mBBr. This ANF-binding event in the case of the BADAN-modified enzyme is characterized by an S50 of 18.2 +/- 0.7, compared with the value of 2.2 +/- 0.3 for the ANF-induced spin transition, thus revealing an additional low-affinity binding site. Studies of the effect of TST, 1-PB, and BCT on the interactions of ANF monitored by changes in fluorescence of CYP3A4(C58,C64)-BADAN or by the ANF-induced spin transition revealed no competition by these substrates. Investigation of the kinetics of fluorescence increase upon H2O2-dependent heme depletion suggests that labeled CYP3A4(C58,C64) is represented by two conformers, one of which has the fluorescence of the BADAN and CPM labels completely quenched, presumably by photoinduced electron transfer from the neighboring Trp-72 and/or Tyr-68 residues. The binding of ANF to the newly discovered binding site appears to affect the interactions of the label with the above residue(s), thus modulating the fraction of the fluorescent conformer.


Figures

Figure 1
Figure 1
Spectra of fluorescence emission and excitation of CYP3A4(C58,C64)-BADAN (10 µM solution in 100 mM Na-Hepes puffer, pH 7.4, 1 mM EDTA, 1mM DTT). Panel a shows the spectra of emission (excitation at 260 nm, solid line) and excitation (emission at 490 nm, dashed line) The excitation spectrum of a gluthatione adduct of BADAN (emission at 490 nm) is shown for comparison by a dashed-and-dotted line. Panel b shows the spectra of emission of CYP3A4(C58,C64)-BADAN recorded with excitation at 280 nm (solid line), 315 nm (dashed line) and 385 nm (dashed-and-dotted line). All spectra were recorded at 25 °C in a 5×5 mm quartz cell with emission and excitation bandwidths of 2 nm. The spectra were corrected for the spectral response of the detector. The amplitudes of all spectra were normalized to fit into 0 – 100 units scale.
Figure 2
Figure 2
ANF-induced changes in the absorbance spectra of CYP3A4. (a) A series of absorbance spectra of 1.5 µM enzyme recorded at 0, 1.2, 2.5, 3.7, 6.2, 8.7, 12, and 30 µM ANF. The inset shows the spectrum of the first principal component. (b) ANF-induced changes in the concentration of the high-spin (triangles), low-spin (circles), P420 (squares), and total enzyme (diamonds). Experimental conditions: 100 mM Hepes buffer, pH 7.4, 1 mM DTT, 0.2 mM EDTA, 25 °C.
Figure 3
Figure 3
Interactions of ANF with CYP3A4, CYP3A4(C58,C64), and their BADAN-modified derivatives monitored by the substrate-induced spin shift. A series of absorbance spectra of 1 µM heme protein were recorded at different ANF concentrations, and the percent of high spin content versus the substrate concentration was plotted. The lines show fitting of these data sets to the Hill equation with S50 = 3.7 and n = 2.2 for CYP3A4 (a, circles, solid line), S50= 4.2 and n = 1.7 for CYP3A4-BADAN (a, squares, dashed line), S50= 2.9 and n = 2.0 for CYP3A4(C58,C64) (b, circles, solid line), and S50 = 2.0 and n = 1.6 for CYP3A4(C58,C64)-BADAN (b, squares, dashed line). Experimental conditions as indicated in Figure 1.
Figure 4
Figure 4
Interaction of CYP3A4(C58,C64)-BADAN with ANF monitored by the changes in the fluorescence of the probe. (a) A series of emission spectra of 3 µM enzyme were recorded at 0, 1.3, 3.3,, 6.5, 9.8, 13, 16, 20, 23, 26, 31 and 49 µM ANF. (b) Relative fluorescence intensity versus substrate concentration for CYP3A4(C58,C64)-BADAN and for the enzyme pre-incubated with 1-PB or TST. The lines show fitting of the data sets to the Hill equation with S50 = 18.8 µM and n = 1.8 for CYP3A4(C58,C64) (circles, solid line), S50 = 20.5 µM and n = 1.8 for the enzyme pre-incubated with 15 µM 1-PB (squares, dashed line), and S50 = 25 µM and n = 1.7 (diamonds, solid line) for the enzyme pre-incubated with 100 µM TST. Experimental conditions as indicated in Figure 3.
Figure 5
Figure 5
Interaction of CYP3A4(C58,C64)-CPM with ANF monitored by the changes in the fluorescence of the probe. (a) A series of emission spectra of 1.5 µM CYP3A4(C58,C64)-CPM recorded at 0, 0.4, 1.2, 2, 3, 4, 5, 8, 10, 12, 16 and 24 µM of ANF. (b) Relative fluorescence intensity versus substrate concentration. The lines show the fitting of the data sets to the Hill equation with S50 = 13 µM and n = 1.1. Experimental conditions as indicated in Figure 3.
Figure 6
Figure 6
Interaction of CYP3A4(C58,C64)-mBBr with ANF monitored by the changes in the fluorescence of the probe. (a) A series of emission spectra of 1.5 µM enzyme recorded at 0, 2.4, 6, 12, 24, and 38 µM of ANF. (b) Relative fluorescence intensity versus substrate concentration. The lines show the fitting of the data sets to the Michaelis-Menten equation with KM = 12 µM. Experimental conditions as indicated in Figure 3.
Figure 7
Figure 7
Effect of TST on the fluorescence of CYP3A4(C58,C64)-BADAN in the presence of 25 µM ANF. (a) A series of emission spectra of CYP3A4(C58,C64)-BADAN (3 µM) in the presence of 25 µM ANF recorded at 0, 10, 20, 30, 40, 66, and 92 µM TST. (b) Changes in the relative intensity of fluorescence of CYP3A4(C58,C64)-BADAN upon addition of testosterone in the presence of 25 µM ANF. The line show the fitting of the data set to the Michaelis-Menten equation with KM = 38 µM and the maximal amplitude of fluorescence increase of 37 %. Experimental conditions as indicated in Figure 3.
Figure 8
Figure 8
Effect of increasing concentrations of ANF on the parameters of CYP3A4 interactions with 1-PB monitored by the substrate-induced spin shift. Each data point shown on the graphs represents an average of the results of 2–6 individual experiments. The typical confidence interval (p = 0.05) calculated for these estimates was about ± 20% of the respective values. Solid lines shown in panels a and c represent the results of the fitting of the data sets to the Michaelis-Menten equation (KM values of 2.5 µM and 18 µM, respectively). The line in panel b represents the fitting of the data set by a third-order polynomial. The curve is given solely to visualize the general trend of the points and has no conceptual meaning.
Figure 9
Figure 9
Kinetics of H2O2-dependent heme depletion (circles) and the corresponding changes in the intensity of fluorescence of the label (squares) in CYP3A4(C58,C64)-CPM in linear (a) and semi-logarithmic (b) coordinates. Conditions: 1.5 µM CYP3A4(C58,C64)-CPM and 60 mM H2O2 in 0.1 M Na-HERES buffer, 1mM DTT, 1mM EDTA.
Figure 10
Figure 10
Kinetics of modification of CYP3A4(C58,C64) (circles, solid line), CYP3A4(C58) (rectangles, solid line) and CYP3A4(C64) (triangles, dashed line) by BADAN. Conditions: 10 µM heme protein and 12 µM BADAN in 0.1 M Na-Hepes buffer, pH 7.4, 10% glycerol, 0.2% Igepal CO-630 under Argon atmosphere and a constant stirring. The reaction was monitored by increase in fluorescence at 500 nm (excitation at 400 nm). The lines show the approximation of the experimental results with a second order kinetic equation with the rate constants of 18.0, 10.0 and 17.8 mM−1 min−1 for CYP3A4(C58,C64), CYP3A4(C58), and CYP3A4(C64), respectively.
Figure 11
Figure 11
Fragment of structure of cytochrome P450 3A4 (PDB entry 1TQN) (54) illustrating the neighborhood of Cys-58 and Cys-64.

Similar articles

Cited by

References

    1. Atkins WM. Non-Michaelis-Menten kinetics in cytochrome P450-catalyzed reactions. Annu. Rev. Pharmacol. Toxicol. 2005;45:291–310. - PubMed
    1. Atkins WM. Implications of the allosteric kinetics of cytochrome P450s. Drug Discovery Today. 2004;9:478–484. - PubMed
    1. Yoon MY, Campbell AP, Atkins WM. "Allosterism" in the elementary steps of the cytochrome P450 reaction cycle. Drug Metab. Rev. 2004;36:219–230. - PubMed
    1. Ekins S, Stresser DM, Williams JA. In vitro and pharmacophore insights into CYP3A enzymes. Trends Pharm. Sci. 2003;24:161–166. - PubMed
    1. Khan KK, Liu H, Halpert JR. Homotropic versus heterotopic cooperativity of cytochrome P450eryF: A substrate oxidation and spectral titration study. Drug Metab. Disp. 2003;31:356–359. - PubMed

Publication types

MeSH terms