. 2007 Jan;5(1):e12.
doi: 10.1371/journal.pbio.0050012.

Timing and sequence of brain activity in top-down control of visual-spatial attention

Affiliations

Timing and sequence of brain activity in top-down control of visual-spatial attention

Tineke Grent-'t-Jong et al. PLoS Biol. 2007 Jan.

Abstract

Recent brain imaging studies using functional magnetic resonance imaging (fMRI) have implicated a frontal-parietal network in the top-down control of attention. However, little is known about the timing and sequence of activations within this network. To investigate these timing questions, we used event-related electrical brain potentials (ERPs) and a specially designed visual-spatial attentional-cueing paradigm, which were applied as part of a multi-methodological approach that included a closely corresponding event-related fMRI study using an identical paradigm. In the first 400 ms post cue, attention-directing and control cues elicited similar general cue-processing activity, corresponding to the more lateral subregions of the frontal-parietal network identified with the fMRI. Following this, the attention-directing cues elicited a sustained negative-polarity brain wave that was absent for control cues. This activity could be linked to the more medial frontal-parietal subregions similarly identified in the fMRI as specifically involved in attentional orienting. Critically, both the scalp ERPs and the fMRI-seeded source modeling for this orienting-related activity indicated an earlier onset of frontal versus parietal contribution ( approximately 400 versus approximately 700 ms). This was then followed ( approximately 800-900 ms) by pretarget biasing activity in the region-specific visual-sensory occipital cortex. These results indicate an activation sequence of key components of the attentional-control brain network, providing insight into their functional roles. More specifically, these results suggest that voluntary attentional orienting is initiated by medial portions of frontal cortex, which then recruit medial parietal areas. Together, these areas then implement biasing of region-specific visual-sensory cortex to facilitate the processing of upcoming visual stimuli.


Conflict of interest statement

Competing interests. The authors have declared that no competing interests exist.

Figures
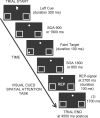
Figure 1
Figure 1. Example of an Attend-Left Cue–Plus–Target Trial
A centrally presented left cue (letter L) instructed the participant to covertly attend to the lower left visual field box to detect an upcoming faint dot target that might be presented there. A target could appear either early or late (50% probability) following the cue and at the valid location only. An end-of-trial signal (the letters REP) presented at 2,700 ms post-cue signaled the participant to press a button to report if they had seen a target. Other trial types included attend-right cue–plus–target, attend-left cue–only (no target), attend-right cue–only (no target), interpret-cue (also no target), and NoStim trials (no cue nor target). SOA, stimulus onset asynchrony; ITI, interstimulus interval.
Figure 2
Figure 2. Cue-Related ERP and fMRI Responses
(A) Grand average across participants (n = 13) of the ERP traces from 16 of the channels across the scalp of the cue-triggered responses to attend-cue trials (collapsed over right and left and also across cue-only and cue-plus–late-target trials), overlaid on the cue responses for interpret-cue trials, starting 200 ms before cue onset until 1,900 ms (which was the onset of a target on trials with a late target). (B) Grand-average (n = 13) ERP difference waves of the attend-cue responses minus interpret-cue responses from (A). (C) ERP topographic maps of these scalp-potential distributions, averaged over 200-ms windows, for attend cues, interpret cues, and their difference waves, starting at the onset of the cues and ending 100 ms before the time of a possible late target presentation. On the right are shown the corresponding fMRI activations (at Talairach height of z = +48) for the attend-cue–only and interpret-cue responses (corrected for overlap) and for the attend-cue–versus–interpret-cue contrasts observed in the identical conditions in the corresponding Woldorff et al. (2004) fMRI study [22].
Figure 3
Figure 3. Timing of Activity in the Medial Frontal–Parietal Attentional-Orienting Network
(A) Grand-average (n = 13) ERP traces selected from channels located at scalp sites above the medial frontal and medial parietal fMRI foci for the difference waves derived from the contrast of attend cues versus interpret cues. The traces for the frontal and parietal scalp are overlaid, showing the temporal delay for the parietal relative to the frontal scalp sites. Below the ERP traces, the horizontal colored bars indicate the windows in which the attentional-orienting activity across participants was significant at the frontal channels (red) and at the parietal channels (blue). (B) Overlay of the estimated source activity waveforms for the medial frontal and medial parietal sources, separately for each hemisphere, also showing the relative delay for the parietal relative to the frontal sources. These source activity waveforms resulted from source modeling of the grand-average (n = 13) ERP difference wave for attend cues versus interpret cues, using dipoles constrained to fMRI centroids of activity (obtained from Woldorff et. al 2004) [22]. Below the source activity waveforms, the horizontal colored bars represent the windows in which the attentional-orienting activity across participants was significant for the estimated frontal source (red) and parietal source (blue) activity waveforms.
Figure 4
Figure 4. Evidence for Robustness of the Four-Source Frontal-Parietal Model of the Attentional Orienting Activity
(A) Explained variance of three different source configurations (frontal only, parietal only, and both frontal and parietal) for the grand-average (n = 13) difference-wave activity between attend and interpret cue responses. These were computed across time (500–1,900 ms) in windows of 200 ms, using the locations and orientations of the sources from the initial fMRI-seeded solution. Note that in the earlier windows, the solution with only two frontal sources (thin black line) explains the variance in the data very well (and better than the solution with only two parietal sources). But later in time, both frontal and parietal sources (thick black line) are needed to explain the data. (B) Topographic distributions of the grand-average (n = 13) attentional-orienting activity at 500–600 ms (upper left map), at 1,100–1,200 ms (lower left map), and the calculated difference between these. Note that the residual activity after the subtraction has a clearly posterior parietal distribution, consistent with a model in which additional posterior sources activate later, rather than a model with only anterior sources that just become more strongly activated over time. (C) Same as (B) but with the attentional-orienting activity between 500–600 ms being scaled in amplitude first, before the subtraction from the activity during the distribution at the later window (i.e., amplitudes at all channels from the early activity were first multiplied by a factor 1.6 to approximately match the amplitude of the midfrontal activity in the later window between 1,100–1,200 ms). Note that the frontal activity is now even more subtracted out, but there still remains clear activity with a posterior parietal maximum.
Figure 5
Figure 5. Pretarget Visual Cortex Biasing
Grand-average (n = 13) ERP topographic plots (back view) time locked to attend-left cues (upper left row), attend-right cues (middle left row), and the difference-wave plots for the attend-left cues minus the attend-right cues (lower left row), averaged over 200-ms bins, starting 500 ms post-cue until the onset of late targets at 1,900 ms. The far right column shows N1 latency back-view topographic plots for left targets (upper right), right targets (middle right), and the left-minus-right target difference wave (lower right). All target-related activity is corrected for overlap from previous cue activity. Note the build up and then maintenance of the biasing-related negativity BRN over the occipital cortex contralateral to the direction of attention, and also note the similarity of the scalp-potential distributions of this biasing-related activity to the N1 differences between left and right targets.

Comment in

Similar articles

Cited by

References

    1. Posner MI, Snyder CR, Davidson BJ. Attention and the detection of signals. J Exp Psychol. 1980;109:160–174. - PubMed
    1. Downing CJ. Expectancy and visual-spatial attention: Effects on perceptual quality. J Exp Psychol Hum Percept Perform. 1988;14:188–202. - PubMed
    1. Mangun GR, Hillyard SA. Modulations of sensory-evoked brain potentials indicate changes in perceptual processing during visual-spatial priming. J Exp Psychol Hum Percept Perform. 1991;17:1057–1074. - PubMed
    1. Heinze HJ, Mangun GR, Burchert W, Hinrichs H, Scholz M, et al. Combined spatial and temporal imaging of brain activity during visual selective attention in humans. Nature. 1994;372:543–546. - PubMed
    1. Woldorff MG, Fox PT, Matzke M, Lancaster JL, Veeraswamy S, et al. Retinotopic organization of early visual spatial attention effects as revealed by PET and ERPs. Human Brain Mapping. 1997;5:280–286. - PubMed

Publication types