. 2007 Jan;170(1):399-415.
doi: 10.2353/ajpath.2007.060351.

Overexpression of Notch1 ectodomain in myeloid cells induces vascular malformations through a paracrine pathway

Affiliations

Overexpression of Notch1 ectodomain in myeloid cells induces vascular malformations through a paracrine pathway

Xiujie Li et al. Am J Pathol. 2007 Jan.

Abstract

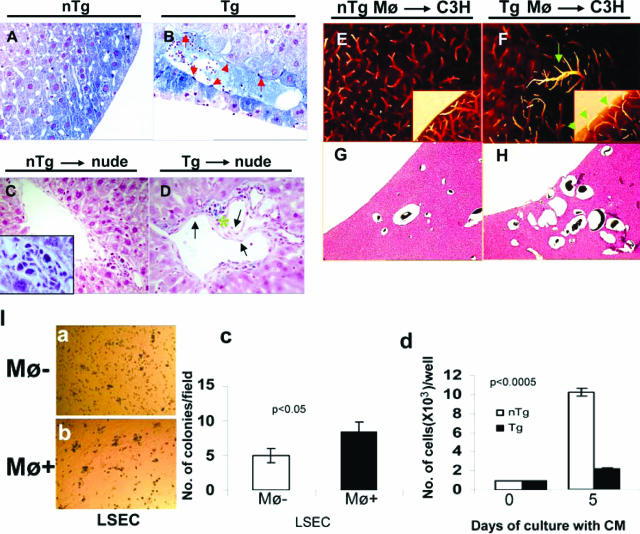
We previously reported that truncation of Notch1 (N1) by provirus insertion leads to overexpression of both the intracellular (N1(IC)) and the extracellular (N1(EC)) domains. We produced transgenic (Tg) mice expressing N1(EC) in T cells and in cells of the myeloid lineage under the regulation of the CD4 gene. These CD4C/N1(EC) Tg mice developed vascular disease, predominantly in the liver: superficial distorted vessels, cavernae, lower branching of parenchymal vessels, capillarized sinusoids, and aberrant smooth muscle/endothelial cell topography. The disease developed in lethally irradiated normal mice transplanted with Tg bone marrow or fetal liver cells as well as in Rag-/- Tg mice. In nude mice transplanted with fetal liver cells from (ROSA26 x CD4C/N1(EC)) F1 Tg mice, abnormal vessels were of recipient origin. Transplantation of Tg peritoneal macrophages into normal recipients also induced abnormal vessels. These Tg macrophages showed impaired functions, and their conditioned medium inhibited the proliferation of liver sinusoid endothelial cells in vitro. The Egr-1 gene and some of its targets (Jag1, FIII, FXIII-A, MCP-1, and MCP-5), previously implicated in hemangioma or vascular malformations, were overexpressed in Tg macrophages. These results show that myeloid cells can be reprogrammed by N1(EC) to induce vascular malformations through a paracrine pathway.


Figures

Figure 1
Figure 1
Structure of the CD4C/N1EC DNA and its expression in Tg mice. A: Structure of the transgene. White bar, the CD4C regulatory sequences, including the mouse CD4 enhancer (enh), the human CD4 promoter (prom) with exon 1 and intron 1; stippled bar, the N1EC cDNA containing 36 epidermal growth factor-like repeats; black bar, the polyadenylation sequences from simian virus 40 (SV40). A, AatII; Bs, BssII; E, EcoRI; N, NotI. B: Northern blot analysis of RNA from CD4C/N1EC Tg mice. RNA (10 μg) was extracted from different tissues and hybridized with 32P-labeled probe M, specific to the Notch1 epidermal growth factor-like repeats. The filters were then washed and rehybridized with the ribosomal 18S-specific probe (1 to 16). On the other hand, the agarose gel was stained with ethidium bromide before transfer to the membrane and photographed under UV irradiation (lanes 17 through 25). T, thymus; L, liver; LN, lymph nodes; K, kidney. Negative (−) controls (C): HC11 cells, lane 8, or nTg thymus, lanes 16 and 17. Positive (+) controls (C): HC11 cells transfected with N1EC, lane 7, or Tg thymus, lanes 15 and 18. C: Western blot of N1EC proteins. Total protein extracts (100 μg) from whole thymus or liver, sorted CD4+CD8+ thymocytes, and peritoneal macrophages of the Tg and non-Tg littermates were evaluated with anti-N1EC antibody. The membrane was then stripped and probed with anti-actin antibodies. Negative (−) and positive (+) controls (C) are, respectively, HC11 and NIEC-expressing HC11 cells.
Figure 2
Figure 2
Vascular disease of the liver and spleen in CD4C/N1EC Tg mice. A and B: Macroscopic analysis of control non-Tg (A) or Tg (B) liver. The Tg livers had irregular shapes. After perfusion with Microfil, huge and spider-like white vessels were observed at their surface. C–H: Microscopic analysis. Note the extensive vascular branching and the homogeneous capillary networks in non-Tg mouse (C). D: In Tg mice, fewer and shorter branches were observed. E: Quantitation of branching. In addition, various remodeling defects of the vasculature were observed in the Tg livers. F, G, and H: Large vessels growing ectopically out of the liver (arrow), clustered and dilated capillaries, fewer large parenchymal vessels, and hemangioma capillaries (H, inset). C, D, G, and H: 0.5 × 5; F and I: 0.5 × 10. I and J: Low power view of sectioned livers. Tg (J) but not non-Tg (I) livers show hemangioma-like cavernae (asterisks) with thrombi (arrow) within their lumen. K and L: Large and superficial vascular malformations are observed in Tg spleen (L) but not in non-Tg spleen (K).
Figure 3
Figure 3
Liver and vessel remodeling in CD4/N1EC Tg mice. AE: H&E staining. Non-Tg liver (A and C) shows regular lobules, where the central vein (CV) is located in the center surrounded by portal vein (PV) and biliary duct (BD). In contrast, the Tg liver (B) shows irregular and heterogeneous lobules with reverse lobule (B and D). C: Intercalating and paralleled sinusoids are distributed in the non-Tg lobule zone “1” (S1) and zone “2” (S2), respectively. D: In the Tg lobules, sinusoids in S1 become dilated and capillarized and the parallel sinusoids have disappeared in some regions of S2, where more than five hepatocytes are clamped together. E: Hemangioma-like caverna in Tg liver. PA, portal artery; S, sinusoids; dark arrows, BD; green arrows, large vessels on the surface of the liver. Magnification: ×2.5 (A and B); ×10 (C and D); and ×5 (E). FJ: Vessel remodeling. Confocal microscopy performed with anti-CD31 (fluorescein isothiocyanate) and anti-smooth muscle actin (red Texas) antibodies. A large vessel at the surface of the Tg liver (G) was compared with that of a normal liver (F). Notice the discontinuity of the Tg endothelial cells and their aberrant location relative to the SMC layer. Also note heterogeneously distributed CD31 positivity in Tg sinusoids (J) but not in non-Tg (F) sinusoids. H and I: Intrahepatic large vessel of non-Tg (H) or Tg (I) liver. Notice the scattering of the SMC away from the endothelial cells, in Tg liver. KM: Disruption of Tg sinusoids in double (CD4C/N1EC × L-SIGN/GFP) Tg mice close to large vessels (*). Note the decreased and patched staining in the Tg liver (L and M).
Figure 4
Figure 4
The liver vascular disease of CD4C/N1EC Tg mice begins during embryogenesis and develops after partial hepatectomy (PH) in adult CD4C/N1EC Tg mice. A–H: Both embryonic (E16.5 days) (A–D) and postnatal (P6) (E–H) stages were examined. Livers were perfused with Microfil (A, C, E, and G) to show the vascular morphology and those fixed with 4% formaldehyde used for H&E staining (B, D, F, and H). Homogenous vessels were observed in the non-Tg livers (A and E). In the Tg livers at E16.5, heterogeneous and denser distribution of capillaries (especially extending the liver capsule) is evident, although the liver structure and vessel branching remained relatively normal (C). At P6, the phenotype was more apparent. Large clustered vessels and dilated capillaries (arrowhead) close to the surface of the Tg liver and decreased branching are observed. G and H: In addition, the liver structure was disrupted. E and F: No such abnormalities were ever found in the non-Tg livers. Magnification: ×5 (A, C, E, and G); ×20 (B, D, F, and H). I–M: PH involves ligation of two-third quarter lobes. I: Macroscopic analysis. Nonhepatectomized (a and c) and hepatectomized (b and d) livers from the CD4C/N1EC Tg mice (c and d) and their non-Tg (a and b) littermates were compared after perfusion with Microfil. In non-Tg mice, note the large lobe regenerating after PH (b, arrowhead) relative to the nonhepatectomized liver (a, arrowhead). Such hypertrophy is not observed in Tg mice (d, arrowhead). J–M: Microscopic analysis. The vasculature of both nonhepatectomized (J) and regenerated hepatectomized (K) livers of the non-Tg mice is homogeneous. Abnormal vessels are present in both nonhepatectomized (L) and regenerated hepatectomized (M) Tg livers (Magnification, ×5).
Figure 5
Figure 5
Liver vascular disease develops in mice transplanted with BM cells from CD4C/N1EC Tg mice or in Rag1−/−CD4C/N1EC Tg mice. A and B: Transplantation. Recipient C3H mice (3 to 4 months old) transplanted with non-Tg and Tg BM cells were perfused with Microfil and analyzed 3 to 4 months after transplantation. Huge vessels were apparent on the surface of the liver from mice reconstituted with Tg BM cells (B, arrow). A large cavity (B, asterisk) and a cluster of capillaries-hemangioma-like vessels (B, circle) were also observed. No such lesions develop in the liver of mice transplanted with non-Tg BM cells (A) 0.5 × 10. C and D: Analysis of Rag1−/− CD4C/N1EC Tg mice. The mice were observed at 3 days postnatally or in adulthood, although very few Rag1−/− Tg mice survived later than 5.5 days postnatally. Irregular capillaries (arrowheads), large vessels (arrows) along the edge of the liver, and a cavity (asterisk) were observed in Rag1−/− or Rag+/− Tg mice (D), but were absent in non-Tg mice (C) P3.5, 0.5 × 10 in bright field. Adult, 0.5 × 4.0 in dark field.
Figure 6
Figure 6
CD4C/N1EC Tg macrophages express N1EC and show impaired functions. A–D: Tg expression in macrophages. Tg RNA expression was detected by in situ hybridization in KC-like cells in the Tg liver section (A) and in purified Tg KCs (B) and further confirmed N1EC in Tg KCs by RT-PCR (B). Tg N1EC protein expression was detected in macrophages by IHC (C) (×40) or in macrophage supernatant by Western blot (D) (1: 400 × g supernatant; 2: 100,000 × g (45 minutes) supernatant; 3: 100,000 × g pellet). PR, Ponceau Red. E: Infiltration of macrophages around abnormal Tg vessels. Frozen liver sections were used for IHC using the monoclonal antibody for Mac-1. The non-Tg (a) and Tg (b and c) livers were compared. Note that, in contrast to the weak staining detected in the non-Tg liver section (a), a strong staining was observed around vessels in the Tg liver (b). Higher magnification showed large stained cells (c). Magnification: ×10 (a and b); ×100 (c). F: EM. Quantitation of KCs present in the sinusoids of Tg (28 fields) or non-Tg (11 fields) liver. G: Increased phagocytosis of Tg macrophages. Two hours before sacrifice, latex beads (8.7 × 10⁷/mouse) were injected into 4- to 6-month-old non-Tg (n = 3) or Tg (n = 4) mice by tail vein. Frozen liver sections were used to count the beads captured by KCs. Note that Tg KCs capture more beads than non-Tg cells. H: Increased accumulation of EB in Tg macrophages. EB was injected via the tail vein, and mice were sacrificed 1 to 2 hours after injection. Frozen liver sections were prepared and examined by fluorescence microscopy. Strong fluorescence was observed in cells having macrophage/monocyte morphology in Tg sinusoids. Magnification, ×20.
Figure 7
Figure 7
The liver vascular disease develops in CD4C/N1EC Tg mice through a paracrine pathway that seems to involve macrophages. A and B: Liver vascular disease in chimeric mice. Chimeric mice were generated by fusing E2.5-day embryos from ROSA26 with those of CD4C/N1EC Tg or non-Tg mice. Chimeric mice were analyzed at 5 to 6 months of age by X-gal staining of their livers. In ROSA26 Tg chimera (B), large vessels located on the surface of the liver developed, and some of them stained blue, indicating their ROSA26 parental origin. No such vessels were observed in the ROSA26 non-Tg chimeric livers (A). C and D: Fetal liver cell transplantation. Fetal liver cells from control (non-Tg × ROSA26) F1 and from Tg (CD4C/N1EC Tg × ROSA26) F1 E14.5-day embryos were transplanted into 2- to 3-month-old nude mice. Two months later, mice were sacrificed and analyzed by X-gal staining (n = 2 for each group). Abnormal β-gal-negative vessels (arrows) and infiltration of β-gal-positive hematopoietic cells, including macrophages (asterisk), were observed in the liver from the mice transplanted with Tg cells (D), but not in mice receiving non-Tg cells (C). Magnification, ×20. E–H: Macrophage transplantation. Peritoneal macrophages (3 × 10⁶) from 3- to 4-month-old Tg and non-Tg mice were transplanted by intravenous inoculation into 2- to 3-month-old normal mice, and recipient animals were sacrificed 1 month later and perfused with Microfil (E and F). Note the abnormal vessels (arrows) in the liver of a mouse transplanted with Tg macrophages (F and inset). Magnification, 0.5 × 5.0. G and H: Histological analysis performed on the Microfil-perfused livers showed superficially clustered large vessels in the liver from a mouse transplanted with Tg macrophages (H), but not in the liver from a mouse transplanted with non-Tg ones (G). Magnification, ×5. I: Interaction of CD4C/N1EC Tg macrophages with LSECs. a–c: Peritoneal macrophages from Tg or non-Tg mice were co-cultured with normal LSECs, labeled with latex beads or Dil-Ac-LDL, respectively. The number of clusters (5×) formed by non-Tg (a) or Tg (b) macrophages clumped onto the LSECs was counted after 3 to 4 hours of incubation and quantitated (c). d: Supernatants of Tg macrophages inhibit the growth of non-Tg LSECs. Purified LSECs were incubated with conditioned medium (CM) from non-Tg or Tg peritoneal macrophages in 48-well plates. After 5 days of incubation, cells were counted.
Figure 8
Figure 8
Expression analysis of candidate genes in macrophages of CD4C/N1EC Tg mice. A: RNA was extracted from non-Tg and Tg peritoneal macrophages. Expressions of the indicated genes were measured by quantitative PCR. Values for each gene are expressed relative to S16 expression. These results were reproduced with either pooled cells (three mice/non-Tg or Tg group, n = 2, pooled experiments) four times or cells from individual mice (n = 3, non-Tg or Tg) twice. All statistical differences were obtained by the Student’s t-test, except for MCP-5 and Egr-1 where the F-test was used. B: Egr-1 binding sites in the indicated genes, as searched with the MatInspector/Genomatix software or by sequence comparison for MCP-1. This latter site is identical to the Egr-1 site of the mouse luteinizing hormone-β gene.

Similar articles

Cited by

References

    1. Artavanis-Tsakonas S, Rand MD, Lake RJ. Notch signaling: cell fate control and signal integration in development. Science. 1999;284:770–776. - PubMed
    1. Kopan R. Notch: a membrane-bound transcription factor. J Cell Sci. 2002;115:1095–1097. - PubMed
    1. Gridley T. Notch signaling during vascular development. Proc Natl Acad Sci USA. 2001;98:5377–5378. - PMC - PubMed
    1. Shawber CJ, Kitajewski J. Notch function in the vasculature: insights from zebrafish, mouse and man. Bioessays. 2004;26:225–234. - PubMed
    1. Rebay I, Fleming RJ, Fehon RG, Cherbas L, Cherbas P, Artavanis-Tsakonas S. Specific EGF repeats of Notch mediate interactions with Delta and Serrate: implications for Notch as a multifunctional receptor. Cell. 1991;67:687–699. - PubMed

Publication types

MeSH terms

Substances