Comparative Study
. 2007 Jan 22;204(1):57-63.
doi: 10.1084/jem.20061852. Epub 2007 Jan 2.

Selective depletion of Foxp3+ regulatory T cells induces a scurfy-like disease

Affiliations
Comparative Study

Selective depletion of Foxp3+ regulatory T cells induces a scurfy-like disease

Katharina Lahl et al. J Exp Med. .

Abstract

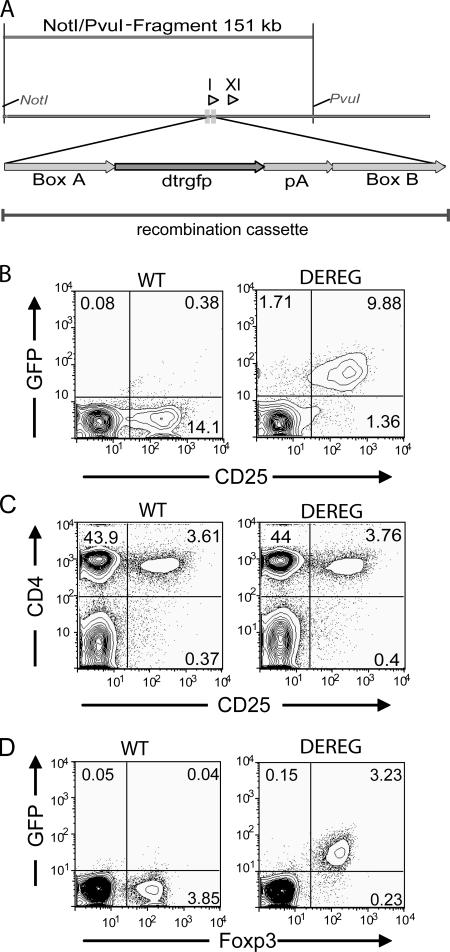
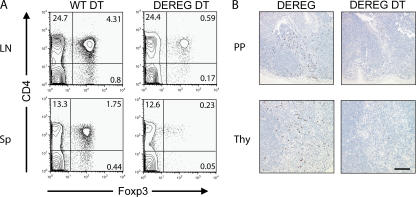
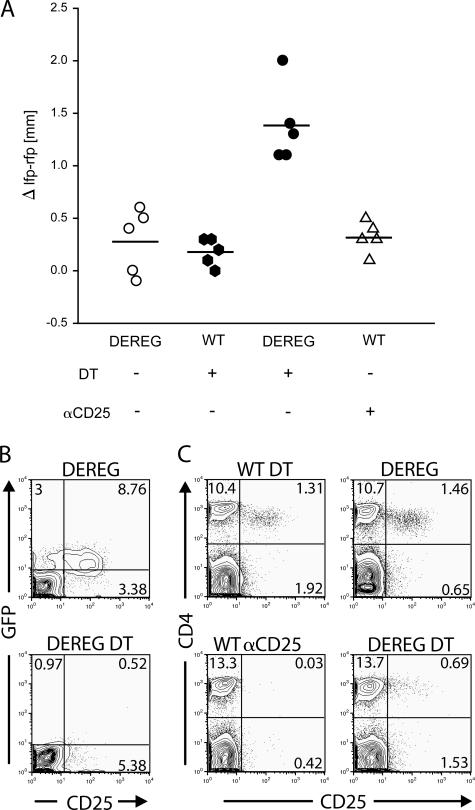
The scurfy mutant mouse strain suffers from a fatal lymphoproliferative disease leading to early death within 3-4 wk of age. A frame-shift mutation of the forkhead box transcription factor Foxp3 has been identified as the molecular cause of this multiorgan autoimmune disease. Foxp3 is a central control element in the development and function of regulatory T cells (T reg cells), which are necessary for the maintenance of self-tolerance. However, it is unclear whether dysfunction or a lack of T reg cells is etiologically involved in scurfy pathogenesis and its human correlate, the IPEX syndrome. We describe the generation of bacterial artificial chromosome-transgenic mice termed "depletion of regulatory T cell" (DEREG) mice expressing a diphtheria toxin (DT) receptor-enhanced green fluorescent protein fusion protein under the control of the foxp3 gene locus, allowing selective and efficient depletion of Foxp3+ T reg cells by DT injection. Ablation of Foxp3+ T reg cells in newborn DEREG mice led to the development of scurfy-like symptoms with splenomegaly, lymphadenopathy, insulitis, and severe skin inflammation. Thus, these data provide experimental evidence that the absence of Foxp3+ T reg cells is indeed sufficient to induce a scurfy-like phenotype. Furthermore, DEREG mice will allow a more precise definition of the function of Foxp3+ T reg cells in immune reactions in vivo.


Figures

Figure 1.
Figure 1.
DEREG mice specifically express DTR-eGFP in T reg cells. (A) Map of BAC construct used for generation of transgenic mice. I and XI indicate the positions of exons I and XI of the foxp3 gene. 24 bp of exon I were replaced by the gene coding for DTR-eGFPpA by homologous recombination with a 1-kb 5′ and 3′ homologous sequence (Boxes A and B). (B) Transgene expression is specific for CD25+CD4+ T cells in naive DEREG mice. Flow cytometric analysis of live-gated CD4+ LN cells of the indicated genotype reveals GFP expression mainly in CD25+CD4+ T cells. (C) Analysis of CD25+CD4+ T cell subsets in LNs from DEREG mice and WT littermates. Plots show similar frequencies of the cell subset in live-gated cells. (D) Foxp3 and GFP expression of LN cells. Flow cytometric analysis reveals a specific transgene expression in T reg cells. Cells are live gated. The percentage of cells in each quadrant (B–D) is indicated.
Figure 2.
Figure 2.
Localization of Foxp3+ cells in the spleen and thymus. (A) Spleen sections were stained with αB220-allophycocyanin (blue), αCD3–Alexa Fluor 555 (red), and αGFP–Alexa Fluor 488 (green). (B) Thymus sections were stained with αCD3–Alexa Fluor 647 (blue), αFoxp3–Alexa Fluor 555 (red), and αGFP–Alexa Fluor 488 (green). Bars: (A and B, left) 500 μm; (A, right) 100 μm; (B, right) 50 μm.
Figure 3.
Figure 3.
Depletion of Foxp3+ cells with DT in DEREG mice. After six consecutive days of DT injection (1 μg/day), mice were killed on day 7, and lymphoid organs were removed. (A) Flow cytometric analysis of LN-derived cells and splenocytes shows efficient depletion of Foxp3+ cells in DT-treated DEREG mice compared with DT-treated WT control mice. The percentage of cells in each quadrant is indicated. (B) Foxp3 staining (brown) of thymic and Peyer's patch (PP) sections shows effective depletion of Foxp3+ cells in DT-treated compared with untreated DEREG mice. Bar, 100 μm.
Figure 4.
Figure 4.
Depletion of Foxp3+ cells in DEREG mice results in enhanced DTH reaction. (A) Differences in thickness between challenged and PBS-injected footpads in the indicated groups of mice 24 h after challenge. Horizontal lines represent the means. (B) Flow cytometric analysis of CD25 and eGFP expression in live-gated peripheral blood CD4+ T cells after DT treatment of DEREG mice (before challenge) and in untreated DEREG control mice reveals that, after depletion, most of the remaining CD25+CD4+ T cells are GFP negative. (C) Frequency of peripheral blood CD25+CD4+ T cells before challenge. Plots show the absence of double-positive cells in mice that received 500 μg αCD25 and a reduction of CD25+CD4+ T cells in DEREG mice injected with 5 × 1 μg DT (bottom). Control groups show the normal frequency of CD25+CD4+ T cells (top). Cells were live gated. Data are representative of one out of three independent experiments with five mice per group. The percentage of cells in each quadrant (B and C) is indicated.
Figure 5.
Figure 5.
Depletion of Foxp3+ cells in neonate DEREG mice results in a scurfy-like phenotype. Neonates were injected i.p. on days 1 and 7 after birth with 500 ng DT and analyzed after 21 d. (A) Splenomegaly in scurfy mice (top) and depleted DEREG mice (middle) compared with a DT-injected WT littermate (bottom). (B) Enlargement and increase of LN cellularity (left, scapular LN; right, inguinal LN; the mean of total cell numbers from four pooled peripheral LN is shown) in scurfy and depleted DEREG mice compared with DT-treated WT littermates. (C) Histological analysis of different organs. Figures show hematoxylin and eosin staining of the indicated organs in the different mice. Bar, 100 μm. (D) Foxp3 staining (brown) of thymus sections shows remaining Foxp3+ expression only in WT littermates. Data are representative of 1 out of 10 independently analyzed mice in which a total of 12 organs each (spleen, LN, Peyer's patches, thymus, liver, pancreas, salivary gland, heart, lung, kidney, gastrointestinal tract, and skin) was evaluated. Bar, 50 μm.

Similar articles

Cited by

References

    1. Sakaguchi, S. 2005. Naturally arising Foxp3-expressing CD25+CD4+ regulatory T cells in immunological tolerance to self and non-self. Nat. Immunol. 6:345–352. - PubMed
    1. von Boehmer, H. 2005. Mechanisms of suppression by suppressor T cells. Nat. Immunol. 6:338–344. - PubMed
    1. Coombes, J.L., N.J. Robinson, K.J. Maloy, H.H. Uhlig, and F. Powrie. 2005. Regulatory T cells and intestinal homeostasis. Immunol. Rev. 204:184–194. - PubMed
    1. Taguchi, O., and T. Takahashi. 1996. Administration of anti-interleukin-2 receptor alpha antibody in vivo induces localized autoimmune disease. Eur. J. Immunol. 26:1608–1612. - PubMed
    1. McHugh, R.S., and E.M. Shevach. 2002. Cutting edge: depletion of CD4+CD25+ regulatory T cells is necessary, but not sufficient, for induction of organ-specific autoimmune disease. J. Immunol. 168:5979–5983. - PubMed

Publication types

MeSH terms