. 2007 Jan 1;176(1):51-63.
doi: 10.1083/jcb.200605097.

Kinesin-1 structural organization and conformational changes revealed by FRET stoichiometry in live cells

Affiliations

Kinesin-1 structural organization and conformational changes revealed by FRET stoichiometry in live cells

Dawen Cai et al. J Cell Biol. .

Abstract

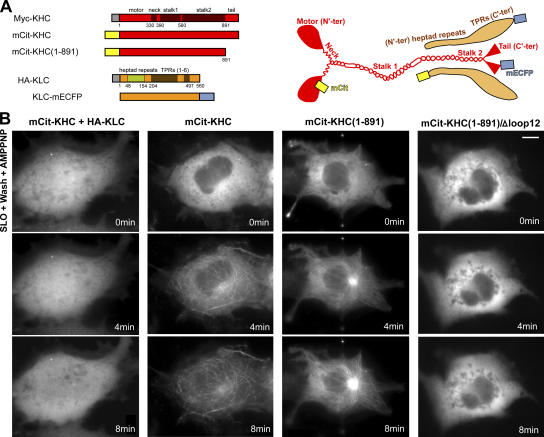
Kinesin motor proteins drive the transport of cellular cargoes along microtubule tracks. How motor protein activity is controlled in cells is unresolved, but it is likely coupled to changes in protein conformation and cargo association. By applying the quantitative method fluorescence resonance energy transfer (FRET) stoichiometry to fluorescent protein (FP)-labeled kinesin heavy chain (KHC) and kinesin light chain (KLC) subunits in live cells, we studied the overall structural organization and conformation of Kinesin-1 in the active and inactive states. Inactive Kinesin-1 molecules are folded and autoinhibited such that the KHC tail blocks the initial interaction of the KHC motor with the microtubule. In addition, in the inactive state, the KHC motor domains are pushed apart by the KLC subunit. Thus, FRET stoichiometry reveals conformational changes of a protein complex in live cells. For Kinesin-1, activation requires a global conformational change that separates the KHC motor and tail domains and a local conformational change that moves the KHC motor domains closer together.


Figures

Figure 1.
Figure 1.
Localization and activity of FP-tagged Kinesin-1 in COS cells. (A, left) Schematic diagram of KHC (red) and KLC (orange) domain structure and positions of the epitope and FP tags. (right) Current model of Kinesin-1 structural organization. Red ovals, KHC motor domains; Red triangles, KHC tail domains; yellow rectangles, mCit; cyan rectangles, mECFP. (B) Live-cell microtubule-binding assay. Cells expressing the indicated KHC and/or KLC constructs were transiently permeabilized with SLO, and then AMPPNP was added. Shown is the mCit channel of videos taken during permeabilization (0 min) and the indicated time points after AMPPNP addition. Bar, 10 μm.
Figure 2.
Figure 2.
FRET monitors conformational changes in Kinesin-1 in live cells. (A) Schematic diagram of the linked mCit-16aa-mECFP calibration molecule, as well as FP-KHC and -KLC constructs. Yellow rectangles, mCit; cyan rectangles, mECFP. (B and D) FRET stoichiometry under different ionic conditions. COS cells expressing mCit-KHC-mECFP + Myc-KHC + HA-KLC (B) or the mCit-16aa-mECFP (D) calibration molecule were imaged (−1 min), permeabilized with SLO (0 min), kept in physiological salt buffer (low ion) for 5 min, and supplemented with high salt (6 min). Shown are the images collected as fluorescence (IF, top), mCit/mECFP molar ratio (RM, middle), and FRET efficiency (E AVE, bottom). High salt causes a conformational change in KHC + KLC (B), but not in mCit-16aa-mECFP (D). Bars, 10 μm. (C) Quantification of FRET efficiency for cells expressing mCit-KHC-mECFP + Myc-KHC + HA-KLC (left; n = 5) or the mCit-16aa-mECFP molecule (right; n = 8) under physiological salt (open bars) and high salt (hatched bars) conditions. Data are the mean ± the SD. *, P < 0.001.
Figure 3.
Figure 3.
Structural organization of inactive and active Kinesin-1 in live COS cells. (A) FRET stoichiometry of inactive Kinesin-1 (KHC + KLC). (top left) Representative fluorescence image. (top right) The white boxed area of the image was enlarged, binned, and threshold-masked for FRET stoichiometry. For 1–11, the FRET pair being analyzed is indicated on the top, the transfected constructs are shown schematically in the middle left, and the calculated FRET efficiencies (E AVE) and n values are indicated on the bottom. The cartoon illustration on the right side of each panel indicates the interpreted structure of Kinesin-1 based on the measured FRET efficiencies. In 1 and 2, the black-lined motor and tail domains are from the same KHC polypeptide chain. (B) FRET stoichiometry of active Kinesin-1 (KHC alone). (top left) Representative fluorescence image. (top right) Enlarged, binned, and threshold-masked region for FRET stoichiometry that distinguishes molecules accumulated in the cell periphery (red region in top right and red numbers in 1–4) from molecules soluble in the rest of the cell (blue region in top right and blue numbers in 5–11). For 1–8, the FRET pair being analyzed is indicated at the top, the transfected constructs are shown schematically in the center, and the n values are indicated at the bottom. The measured FRET efficiencies and interpreted Kinesin-1 structures are indicated on the left for KHC molecules accumulated at the microtubule plus ends (1–4) and on the right for KHC molecules soluble in the cell (5–8). For 9–11, the data are presented as in A. Microtubules are represented as light green (β-tubulin) and light gray (α-tubulin) rod shapes. “+” and “−” signs represent the plus and minus ends of the microtubules. Yellow rectangles, mCit; cyan rectangles, mECFP. Data are the mean ± the SD. Bars, 10 μm.
Figure 4.
Figure 4.
Conformational changes upon Kinesin-1 activation. Inactive Kinesin-1 (left) is in a folded conformation such that the KHC motor and tail domains are in close proximity (green arrow), but the KHC motor domains are pushed apart from each other (blue arrow). Upon activation (right), the KHC motor and tail domains are more widely separated (green arrow), whereas the KHC motor domains come closer together (blue arrow). Microtubules are represented as light green (β-tubulin) and light gray (α-tubulin) rod shapes. “+” and “−” signs represent the plus and minus ends of the microtubules.
Figure 5.
Figure 5.
The KHC motor/neck domains are separated in the inactive molecule by the presence of KLC. (A) Schematic diagram of mECFP-tagged KHC(Cys344) and KLC in the Kinesin-1 holoenzyme. (B) Lysates of COS cells expressing KHC(Cys344) alone (left) or with KLC (right) were treated with the cross-linker DTNB for the indicated times. Cross-linking was stopped by the addition of SDS-PAGE sample buffer, and the lysates were run on nonreducing SDS PAGE gels, transfered to nitrocellulose, and Western blotted with an antibody to FP tag. The size of molecular weight markers (in kiloDaltons) is indicated on the left of the gel.
Figure 6.
Figure 6.
The KHC tail domain contributes to autoinhibition of Kinesin-1, but not conformational changes. (A) Live-cell microtubule-binding assay. mCit fluorescence images of COS cells expressing Myc-KHC + KLC-mCit (right) or Myc-KHC(1–891) + KLC-mCit (left) before permeabilization (top) and after 10 min in the presence of AMPPNP (bottom). (B) Quantification of microtubule binding for Myc-KHC + FP-KLC (red bars; n = 13) or Myc-KHC(1–891) + FP-KLC (blue bars; n = 11) before (open bars) and 20 min after addition of AMPPNP (hatched bars). Motor-to-tail (C–E) and motor-to-motor (F–H) FRET stoichiometry of ΔIAK molecules before and after addition of AMPPNP. (C and F) Shown are the images collected as fluorescence (IF, top row), ratio (RM, middle row), and FRET efficiency (E AVE, bottom row). (D and G) FRET pair being analyzed (top center) and schematic of transfected constructs (middle center). Left sides indicate measured FRET efficiencies, n values, and illustration of interpreted FRET results before the addition of AMPPNP, whereas the right sides indicate the same for after addition of AMPPNP. (E and H) Time course of change in FRET efficiency (E AVE, black line) and Relocation Index (red line). Data are the mean ± the SD. Bars, 10 μm.
Figure 7.
Figure 7.
The KLC subunit contributes to both autoinhibition and conformational changes. (A, 1–6) The FRET pair being analyzed is indicated vertically to the left of the panels, the transfected constructs are shown schematically in the middle left, and the calculated FRET efficiencies (E AVE) and n values are indicated on the bottom left. The cartoon illustration on the right side of each panel indicates the interpreted structure of Kinesin-1, based on the measured FRET efficiencies. In 1 and 2, the black-lined motor and tail domains are from the same KHC polypeptide chain. (B) Model for how KLC domains contribute to autoinhibition of Kinesin-1. In the absence of the TPR motifs, the heptad repeats contribute to autoinhibition by promoting the folded conformation (green arrows, top). The TPR motifs contribute to autoinhibition by separating the KHC motor domains (blue arrows, bottom). Data are the mean ± the SD.
Figure 8.
Figure 8.
Model for activation of Kinesin-1. Full activation of Kinesin-1 requires that the inhibitory effects of both the KHC tail and the KLC subunit must be relieved. This likely requires both cargo (green stars) binding to the KLC TPRs (shown) and cargo or activator (blue ovals) binding to the KHC tail. These two processes may act sequentially (top and bottom paths) or in concert (middle path). Microtubules are represented as light green (β-tubulin) and light gray (α-tubulin) rod shapes. “+” and “−” signs represent the plus and minus ends of the microtubules.

Comment in

  • Jump-starting kinesin.
    Hackney DD. Hackney DD. J Cell Biol. 2007 Jan 1;176(1):7-9. doi: 10.1083/jcb.200611082. J Cell Biol. 2007. PMID: 17200413 Free PMC article.

Similar articles

Cited by

References

    1. Adio, S., J. Reth, F. Bathe, and G. Woehlke. 2006. Review: regulation mechanisms of Kinesin-1. J. Muscle Res. Cell Motil. 27:153–160. - PubMed
    1. Bathe, F., K. Hahlen, R. Dombi, L. Driller, M. Schliwa, and G. Woehlke. 2005. The complex interplay between the neck and hinge domains in kinesin-1 dimerization and motor activity. Mol. Biol. Cell. 16:3529–3537. - PMC - PubMed
    1. Beemiller, P., A.D. Hoppe, and J.A. Swanson. 2006. A phosphatidylinositol-3-kinase-dependent signal transition regulates ARF1 and ARF6 during Fcgamma receptor-mediated phagocytosis. PLoS Biol. 4:e162. - PMC - PubMed
    1. Blasius, T.L., D. Cai, G.T. Jih, C.P. Toret, and K.J. Verhey. 2007. Two binding partners cooperate to activate the molecular motor Kinesin-1. J. Cell Biol. 176:11–17. - PMC - PubMed
    1. Coy, D.L., W.O. Hancock, M. Wagenbach, and J. Howard. 1999. Kinesin's tail domain is an inhibitory regulator of the motor domain. Nat. Cell Biol. 1:288–292. - PubMed

Publication types