. 2007 Jan 1;176(1):101-11.
doi: 10.1083/jcb.200607128.

Spatial targeting of type II protein kinase A to filopodia mediates the regulation of growth cone guidance by cAMP

Affiliations

Spatial targeting of type II protein kinase A to filopodia mediates the regulation of growth cone guidance by cAMP

Jianzhong Han et al. J Cell Biol. .

Abstract

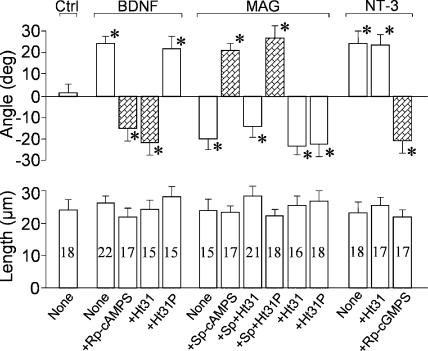
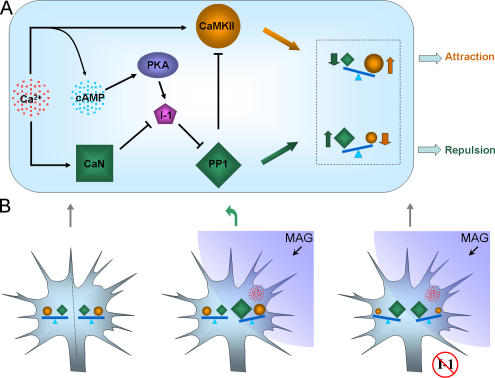
The second messenger cyclic adenosine monophosphate (cAMP) plays a pivotal role in axonal growth and guidance, but its downstream mechanisms remain elusive. In this study, we report that type II protein kinase A (PKA) is highly enriched in growth cone filopodia, and this spatial localization enables the coupling of cAMP signaling to its specific effectors to regulate guidance responses. Disrupting the localization of PKA to filopodia impairs cAMP-mediated growth cone attraction and prevents the switching of repulsive responses to attraction by elevated cAMP. Our data further show that PKA targets protein phosphatase-1 (PP1) through the phosphorylation of a regulatory protein inhibitor-1 (I-1) to promote growth cone attraction. Finally, we find that I-1 and PP1 mediate growth cone repulsion induced by myelin-associated glycoprotein. These findings demonstrate that the spatial localization of type II PKA to growth cone filopodia plays an important role in the regulation of growth cone motility and guidance by cAMP.


Figures

Figure 1.
Figure 1.
Spatial distribution of type I and II PKA in cultured Xenopus neurons. (A) Xenopus PKA regulatory subunits were detected by Western blotting with antibodies against RIIβ and RI. (B–D) Representative fluorescent images of Xenopus neurons stained with the aforementioned antibodies. A typical Xenopus neuron is shown in B, and its growth cone (indicated by the dashed boxes) is shown in an enlarged view in C. The color images are merged fluorescence of RII (red) and RI (green). (E) Representative fluorescent images of a growth cone double labeled in the presence of saturated recombinant RIIβ during primary antibody incubation. (F and G) RII and RI immunofluorescence of Xenopus neurons treated with 50 μM St-Ht31 for 30 min (F) or 50 μM St-Ht31P (G). (H) For quantitative analyses, the neuronal axons were arbitrarily divided into three regions (see inset): the filopodia, the growth cone (GC; excluding filopodia), and the axon (adjacent axonal shaft). For each neuron, the average fluorescence intensities of the filopodia and the growth cone were normalized against that of the axon (F/Faxon). Data from three groups of neurons are summarized and presented as the mean ± SEM (error bars). Ctrl, n = 46; Ht31, n = 15; Ht31P, n = 12. An asterisk indicates significant difference from the control group (P < 0.01; t test). Bars, 10 μm.
Figure 2.
Figure 2.
Growth cone attraction induced by local PKA activation depends on type II PKA anchoring. (A–C) Representative images showing the Xenopus growth cones at the onset and end of a 30-min exposure to a Sp-cAMPS gradient (20 mM in pipette) without (A) and with the bath application of 2 μM St-Ht31 (B) or 2 μM St-Ht31P (C). Dashed lines represent the original directions of growth cone extension, and dotted lines indicate the starting positions of the growth cone. Arrows indicate the directions of the gradients. Bar, 10 μm. (D) Cumulative distributions of turning angles summarize the effects of St-Ht31 and St-Ht31P on the growth cone responses to Sp-cAMPS (top; 20 mM in pipette) and PACAP (1 μM in the pipette). The control was obtained when normal bath solution was in the pipette. Each point depicts the percentage of growth cones bearing a turning angle equal to or less than the value indicated on the x axis. Positive angles indicate attraction. (E) Average turning angles and lengths of net growth cone extension for each condition are shown. The turning responses induced by NT-3 (50 μg/ml in the pipette) serve as the control. Error bars represent SEM. An asterisk indicates significant difference from the control group (P < 0.01; Mann-Whitney test). Numbers indicate the total growth cones examined for each group.
Figure 3.
Figure 3.
Type II PKA anchoring is required for the switching of turning responses by cAMP. Average turning angles and lengths of net growth cone extension show the turning responses of Xenopus growth cones to BDNF (50 μg/ml in pipette), MAG (100 μg/ml in pipette), and NT-3 (50 μg/ml in pipette) gradients with and without bath exposure to cAMP analogues and antagonists. To disrupt RII–AKAP interactions, 2 μM St-Ht31 or St-Ht31P was added in the bath 30 min before the onset of turning assays. Patterned bars indicate switching of the turning response from its original one. Error bars represent SEM. An asterisk indicates significant difference from the control group (P < 0.01; Mann-Whitney test). Numbers indicate the total growth cones examined for each group.
Figure 4.
Figure 4.
PKA phosphorylation of I-1 requires type II PKA anchoring via AKAPs. (A) Immunofluorescent images of a typical rat hippocampal neuron labeled by antibodies recognizing RII and RI. The color panel is the merged fluorescence of the two channels (RII, red; RI, green). (B) Double staining of RII and I-1 in another hippocampal neuron growth cone, with the color panel showing the merged fluorescence (RII, red; I-1, green). (A and B) Bars, 5 μm. (C and D) The effects of 20 μM St-Ht31 and St-Ht31P on forskolin (FSK)-induced I-1 phosphorylation at Thr35 in hippocampal neurons as revealed by Western blotting (C). The phosphorylation level of each condition is normalized by total I-1. Quantification of the data from three independent experiments is shown in D. Error bars represent SEM. The asterisk indicates significant difference compared with the forskolin-treated group (P < 0.01; t test).
Figure 5.
Figure 5.
I-1 mediates PKA-induced growth cone attraction. (A) I-1 distribution in a Xenopus spinal neuron and its colocalization with RII. The color panel represents the merged channels of RII (red) and I-1 (green). (B) A specific I-1 morpholino (IM) or control morpholino (CM) was injected into Xenopus embryos, and the efficiency and specificity of knockdown were examined by Western blotting of whole embryo lysates at stages 20–22 using antibodies against I-1 (top), RII (middle), and PP1γ (bottom). The results are representative of at least three independent experiments. (C) Morpholino oligonucleotides were coinjected with a fixable Oregon green–dextran that could be traced in spinal neuron cultures. Xenopus neurons that are tracer positive (i.e., IM injected; top) exhibit weak I-1 staining (bottom). (A and C) Bars, 5 μm. (D and E) Average turning angles and lengths of net neurite extension showing the turning responses of Xenopus growth cones of IM- or CM-injected neurons to cAMP and PACAP gradients. Error bars represent SEM. An asterisk indicates significant difference from CM neurons (P < 0.01; Mann-Whitney test). Numbers indicate the total growth cones examined for each group.
Figure 6.
Figure 6.
PP1 mediates PKA-induced growth cone attraction. (A) Xenopus neural tube tissues were immunoprecipitated with RII antibody (with or without 20 μM St-Ht31), RI antibody (left), or PP1γ antibody (right). The presence of RII and PP1γ in the precipitates was detected by Western blotting. IPs with normal IgGs were used as negative controls. The bands in the input lane indicate the normal locations of the two proteins. (B) Double staining of RII and PP1γ in a typical Xenopus neuron. The merged color image shows the colocalization of RII (red) and PP1γ (green) in the filopodia. Bar, 5 μm. (C) Turning responses induced by either cAMP and PACAP gradients or local PP1 inhibition. The chemicals shown at the top of the graph were loaded into ejection pipettes at the following concentrations: 10% DMSO, 3 μM tautomycin, 20 mM Sp-cAMPS, and 1 μM PACAP. The turning assays were performed in normal bath solution or in solutions containing the following individual reagents: 20 μM of cyclic nucleotide analogues, 3 nM tautomycin (Taut), 1 nM of the PP2A inhibitor okadaic acid (OA), or 10 nM of the CaN inhibitor deltamethrin (DM). Error bars represent SEM. An asterisk indicates significant difference from the control group (P < 0.01; Mann-Whitney test). Numbers indicate the total growth cones examined for each group.
Figure 7.
Figure 7.
I-1 and PP1 mediate MAG-induced growth cone repulsion. (A) The cumulative distributions of turning angles depict the growth cone responses to a gradient of MAG-Fc (100 μg/ml in the pipette) with and without PP1 inhibition (top) and I-1 knockdown (bottom). 20 μM Sp-cAMPS, 3 nM tautomycin (Taut,), and 1 nM OA were all added to the bath 30 min before the onset of turning assays. (B) Average turning angles and net growth cone extension for each condition are depicted. Patterned bars indicate switching of the turning response from its original one. Error bars represent SEM. An asterisk indicates significant difference from the control group (P < 0.01; Mann-Whitney test). Numbers indicate the total growth cones examined for each group.
Figure 8.
Figure 8.
Growth cone turning induced by local disruption of the AKAP–RII interaction. In the presence of Sp-cAMPS (20 μM in bath), a gradient of St-Ht31 (2 mM in the pipette and ∼2 μM reaching the growth cone) induced repulsive turning. The St-Ht31P gradient (2 mM in the pipette) is a control and had no effect. Average turning angles and lengths of net growth cone extension for each condition are depicted. Error bars represent SEM. An asterisk indicates significant difference from the control group (P < 0.01; Mann-Whitney test). Numbers indicate the total growth cones examined for each group.
Figure 9.
Figure 9.
Schematic diagrams illustrate the model on how Ca2+ and cAMP control the turning responses of growth cones. (A) A modified model involving the CaMKII/CaN–PP1 switch (Wen et al., 2004) and the role of PKA and I-1 in growth cone turning. According to this model, a local imbalance of CaMKII and PP1 activity is the key for generating distinct turning responses. A higher CaMKII or lower PP1 activity favors attraction, whereas a lower CaMKII or higher PP1 activity leads to repulsion. (B) Based on our data, MAG-induced repulsion involves Ca2+ signals (red) that locally elevate PP1 activity, resulting in an imbalance of PP1/CaMKII activity for repulsion. In I-1 knockdown neurons, the MAG gradient can no longer regulate PP1 activity asymmetrically to induce repulsion. Furthermore, PP1 activity is likely elevated as a result of the loss of I-1, which can inhibit CaMKII to prevent attractive turning.

References

    1. Alder, J., H. Kanki, F. Valtorta, P. Greengard, and M.M. Poo. 1995. Overexpression of synaptophysin enhances neurotransmitter secretion at Xenopus neuromuscular synapses. J. Neurosci. 15:511–519. - PMC - PubMed
    1. Aubert, I., J.L. Ridet, and F.H. Gage. 1995. Regeneration in the adult mammalian CNS: guided by development. Curr. Opin. Neurobiol. 5:625–635. - PubMed
    1. Bahr, M., and F. Bonhoeffer. 1994. Perspectives on axonal regeneration in the mammalian CNS. Trends Neurosci. 17:473–479. - PubMed
    1. Banker, G.A., and W.M. Cowan. 1977. Rat hippocampal neurons in dispersed cell culture. Brain Res. 126:397–425. - PubMed
    1. Bauman, A.L., A.S. Goehring, and J.D. Scott. 2004. Orchestration of synaptic plasticity through AKAP signaling complexes. Neuropharmacology. 46:299–310. - PubMed

Publication types

MeSH terms