. 2007 Jan;117(1):246-57.
doi: 10.1172/JCI17645.

Glucokinase and IRS-2 are required for compensatory beta cell hyperplasia in response to high-fat diet-induced insulin resistance

Affiliations

Glucokinase and IRS-2 are required for compensatory beta cell hyperplasia in response to high-fat diet-induced insulin resistance

Yasuo Terauchi et al. J Clin Invest. 2007 Jan.

Abstract

Glucokinase (Gck) functions as a glucose sensor for insulin secretion, and in mice fed standard chow, haploinsufficiency of beta cell-specific Gck (Gck(+/-)) causes impaired insulin secretion to glucose, although the animals have a normal beta cell mass. When fed a high-fat (HF) diet, wild-type mice showed marked beta cell hyperplasia, whereas Gck(+/-) mice demonstrated decreased beta cell replication and insufficient beta cell hyperplasia despite showing a similar degree of insulin resistance. DNA chip analysis revealed decreased insulin receptor substrate 2 (Irs2) expression in HF diet-fed Gck(+/-) mouse islets compared with wild-type islets. Western blot analyses confirmed upregulated Irs2 expression in the islets of HF diet-fed wild-type mice compared with those fed standard chow and reduced expression in HF diet-fed Gck(+/-) mice compared with those of HF diet-fed wild-type mice. HF diet-fed Irs2(+/-) mice failed to show a sufficient increase in beta cell mass, and overexpression of Irs2 in beta cells of HF diet-fed Gck(+/-) mice partially prevented diabetes by increasing beta cell mass. These results suggest that Gck and Irs2 are critical requirements for beta cell hyperplasia to occur in response to HF diet-induced insulin resistance.


Figures
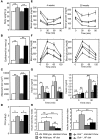
Figure 1
Figure 1. Development of diabetes in Gck+/– mice fed HF diet.
(A and B) Body weight (A) and total weight of white adipose tissue (epididymal and retroperitoneal fat pads) (B) in wild-type and Gck+/– mice after 20 weeks on a standard chow or HF diet (n = 17–20). (C) Cell size in epididymal white adipose tissue (n = 600–900). (D) Serum FFA levels (n = 8–10). (E) Insulin tolerance in wild-type and Gck+/– mice after 4 weeks (left) and 20 weeks (right) on a standard chow or HF diet. Mice were given free access to food and then intraperitoneally injected with 0.75 mU of human insulin per gram body weight. n = 8 (standard chow–fed wild-type), 9 (HF diet–fed wild-type), 12 (standard chow–fed Gck+/–), 14 (HF diet–fed Gck+/–). (F and G) Glucose tolerance in wild-type and Gck+/– mice after 4 and 20 weeks on standard chow or HF diet. (F) Plasma glucose levels. (G) Serum insulin levels. n = 12 (standard chow–fed wild-type), 13 (HF diet–fed wild-type, standard chow– and HF diet–fed Gck+/–). (H) Insulin secretory index, defined as the ratio of insulin to glucose at 30 minutes after a glucose load. Values represent mean ± SEM. *P < 0.05; **P < 0.01.
Figure 2
Figure 2. Failure of compensatory β cell hyperplasia in HF diet–fed Gck+/– mice caused by decreased β cell replication rate.
(A) Histologic analysis of pancreatic islets of wild-type and Gck+/– mice after 20 weeks on standard chow or HF diet. Sections were double stained with anti-insulin antibody and a cocktail of anti-glucagon, anti-somatostatin, and anti-pancreatic polypeptide antibodies. Representative islets are shown. Red stain, β cells; brown stain, non–β cells. Scale bars: 100 μm. (B) Quantitation of β cell and non–β cell mass in wild-type and Gck+/– mice after 20 weeks on standard chow or HF diet. Areas of β or non–β cells (α, δ, and pancreatic polypeptide cells) are shown relative to total pancreas area (n = 4). (C) Changes in β cell mass on HF diet. Shown is β cell area relative to pancreas area (n = 4) after 4, 20, and 40 weeks on HF diet. (D) Number of cells in wild-type and Gck+/– mouse islets after 20 weeks on standard chow or HF diet (n = 6). (E and F) Replication rate of β cells, assayed (E) on the basis of BrdU incorporation after 20 weeks on standard chow or HF diet or (F) by PCNA staining after 20 weeks on HF diet. Results are shown as ratios of double-positive cells to insulin-positive cells (n = 4). Values represent mean ± SEM. *P < 0.05; **P < 0.01.
Figure 3
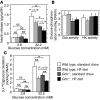
Figure 3. Decreased insulin secretion and glucose oxidation in Gck+/– islets.
(A) Static incubation study of islets from wild-type and Gck+/– mice after 4 weeks on standard chow or HF diet. Static incubation of 10 islets/tube was performed at 37°C for 1 hour with various glucose concentrations after preincubation with a 2.8-mM glucose concentration for 20 minutes. Results are shown as pg insulin/cell/h (n = 4). (B) Gck and hexokinase (HK) activity of islets. Glucose phosphorylation activity was assessed in pancreatic islets from wild-type and Gck+/– mice after 20 weeks on standard chow or HF diet. Results are shown as mol/kg DNA/h (n = 16–20). (C) Glucose oxidation by pancreatic islets from wild-type and Gck+/– mice after 20 weeks on standard chow or HF diet. Results are shown as mol/kg DNA/h (n = 10). *P < 0.05; **P < 0.01.
Figure 4
Figure 4. Changes in gene expression levels in the islets of Gck+/– mice on the HF diet.
(A) RT-PCR analysis of Irs1, Irs2, Igf1r, Prlr, Ipf1, and Arbp (36B4), shown as a control. Islets were isolated from wild-type or Gck+/– mice after 20 weeks on standard chow or HF diet. Experiments were replicated at least 3 times, and typical images are shown. (B) Western blot analysis of Irs2, Igf1r, Insr, Ipf1, and Akt1. Islets were isolated from wild-type or Gck+/– mice after 20 weeks on standard chow or HF diet, Irs1–/– mice, and Irs2–/– mice on standard chow (n = 3). Equal amounts of lysates (20 μg) were blotted with the antibody indicated. Quantitative determination of the β cell mass of islets less than 250 μm in diameter revealed the values in the 4 mouse groups to be indistinguishable (standard chow–fed wild-type, 0.81% ± 0.03%; HF diet–fed wild-type, 0.85% ± 0.03%; standard chow–fed Gck+/–, 0.82% ± 0.02%; HF diet–fed Gck+/–, 0.84% ± 0.02%). (C) Each expression level was quantified (n = 4–6). *P < 0.05; **P < 0.01.
Figure 5
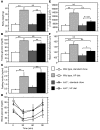
Figure 5. Insufficient β cell hyperplasia in Irs2+/– mice on the HF diet.
(AC) Body weight (A), fasting blood glucose (B), and serum insulin (C) values of wild-type and Irs2+/– mice after 10 weeks on standard chow or HF diet (n = 5–8). (D) Insulin tolerance in wild-type and Irs2+/– mice after 10 weeks on standard chow or HF diet (n = 4–8). (E and F) Area of β cells in each islet (E) and maximum islet diameter (F) in wild-type and Irs2+/– mice after 10 weeks on standard chow or HF diet. We examined 100–150 islets from 3 animals per group. Values represent mean ± SEM. *P < 0.05; **P < 0.01.
Figure 6
Figure 6. Transgenic rescue by crossing Gck+/– mice with βIrs2Tg mice.
(A and B) Glucose tolerance in wild-type, Gck+/–, βIrs2Tg, and βIrs2TgGck+/– mice after 20 weeks on HF diet. (A) Plasma glucose levels. (B) Serum insulin levels. n = 31 (wild-type), 20 (βIrs2Tg), 35 (Gck+/–), 16 (βIrs2TgGck+/–). *P < 0.05, Gck+/– versus βIrs2TgGck+/–. (C) Histologic analysis of wild-type, Gck+/–, βIrs2Tg, and βIrs2TgGck+/– mouse islets after 20 weeks on HF diet. Representative pancreatic islets are shown. Top panels show insulin staining; bottom panels show BrdU staining. Scale bars: 100 μm. Original magnification, ×100 (top panels); ×400 (bottom panels). (D) Area of β cells in each islet after 20 weeks on HF diet. We examined 100–150 islets from 3 animals per group. (E) Replication rate of β cells, assayed on the basis of BrdU incorporation after 20 weeks on HF diet. Results are shown as ratios of insulin and BrdU double-positive cells to insulin-positive cells (n = 4). (F) Static incubation study of islets after 20 weeks on the HF diet. Static incubation of 10 islets/tube was performed at 37°C for 1 hour with various glucose concentrations after preincubation with a 2.8-mM glucose concentration for 20 minutes. Results are shown as pg insulin/cell/h (n = 4). Values represent mean ± SEM. *P < 0.05; **P < 0.01.
Figure 7
Figure 7. Impaired Ser133 phosphorylation of CREB in Gck+/– mice on HF diet.
(A) Western blot assay of Ser133-phosphorylated CREB (p-CREB) and total CREB levels in islets from wild-type and Gck+/– mice after 20 weeks on standard chow or HF diet. (B) Quantitation of Ser133 phosphorylation of CREB in wild-type and Gck+/– mice after 20 weeks on standard chow or HF diet. Results are shown as proportions of the intensity of the Ser133-phosphorylated CREB band to that of the total CREB band (n = 5). Ser133 phosphorylation of CREB was significantly impaired in Gck+/– mice compared with wild-type mice on the HF diet. Values represent mean ± SEM. *P < 0.05.
Figure 8
Figure 8. Nuclear FoxO1-positive cells increased in Gck+/– mice on the HF diet compared with wild-type mice on the HF diet, and overexpression of Irs2 in β cells decreased nuclear FoxO1-positive cells in Gck+/– mice on the HF diet.
(A) Immunohistochemical analysis of FoxO1 in islets from wild-type mice, βIrs2Tg mice, Gck+/– mice, and βIrs2TgGck+/– mice after 20 weeks on the HF diet. Representative islets are shown. FoxO1-positive cells are stained brown. Original magnification, ×600. (B) Ratio of the number of nuclear FoxO1-positive cells to the total number of islet cells. n = 43 (wild-type, Gck+/–), 23 (βIrs2Tg), 48 (βIrs2TgGck+/–). Values represent mean ± SEM. **P < 0.01.

Comment in

Similar articles

Cited by

References

    1. Matschinsky F.M., Ellerman J.E. Metabolism of glucose in the islets of Langerhans. J. Biol. Chem. 1968;243:2730–2736. - PubMed
    1. Velho G., et al. Identification of 14 new glucokinase mutations and description of the clinical profile of 42 MODY-2 families. Diabetologia. 1997;40:217–224. - PubMed
    1. Terauchi Y., et al. Pancreatic β-cell-specific targeted disruption of glucokinase gene. J. Biol. Chem. 1995;270:30253–30256. - PubMed
    1. Matschinsky F.M. Banting Lecture 1995. A lesson in metabolic regulation inspired by the glucokinase glucose sensor paradigm. Diabetes. 1996;45:223–241. - PubMed
    1. Taylor S.I., Accili D., Imai Y. Insulin resistance or insulin deficiency: which is the primary cause of NIDDM? Diabetes. 1994;43:735–740. - PubMed

Publication types

MeSH terms