

Tonotopic distribution of short-term adaptation properties in the cochlear nerve of normal and acoustically overexposed chicks
- PMID: 17200911
- PMCID: PMC2538420
- DOI: 10.1007/s10162-006-0061-8
Tonotopic distribution of short-term adaptation properties in the cochlear nerve of normal and acoustically overexposed chicks
Abstract
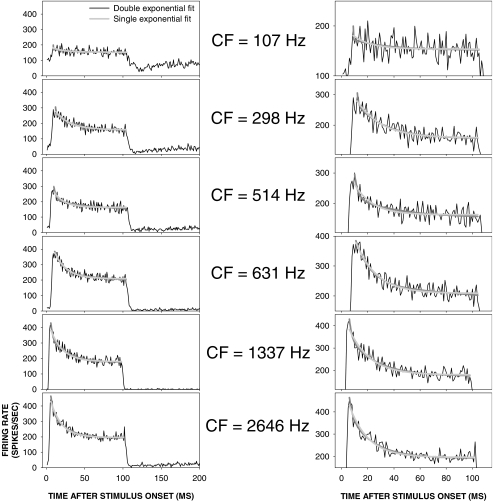
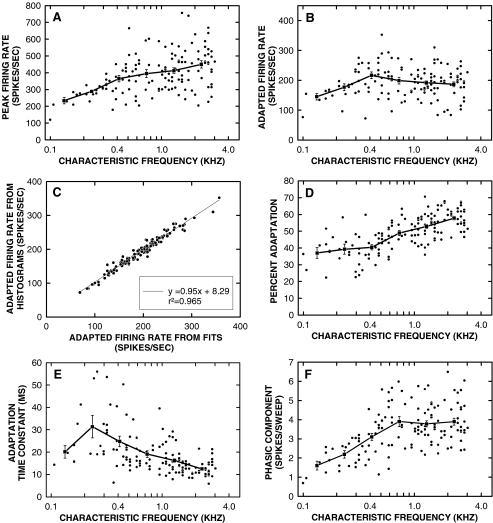
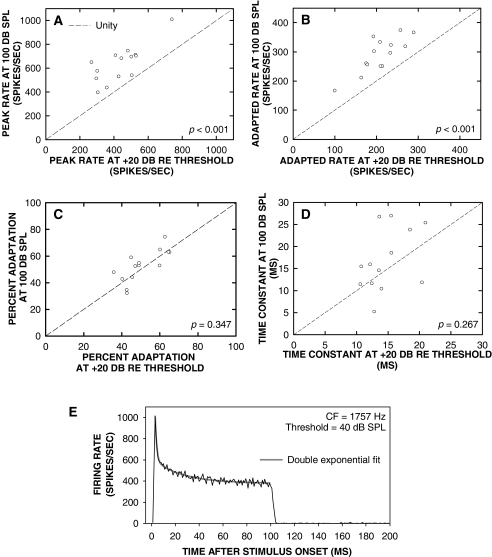
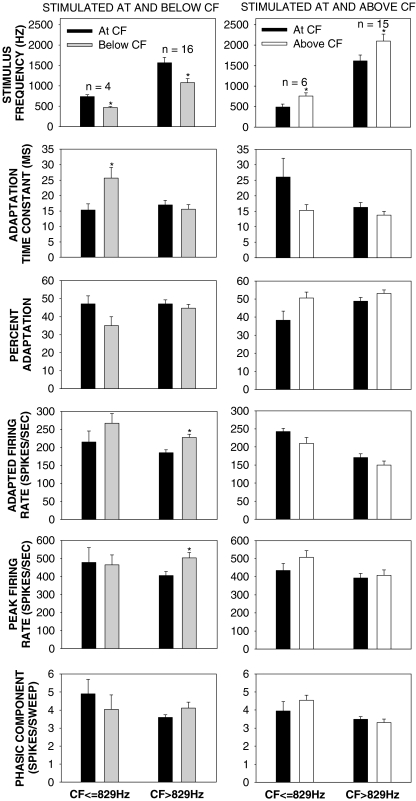
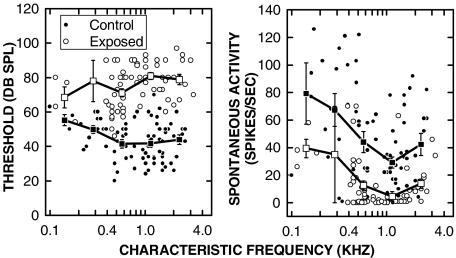
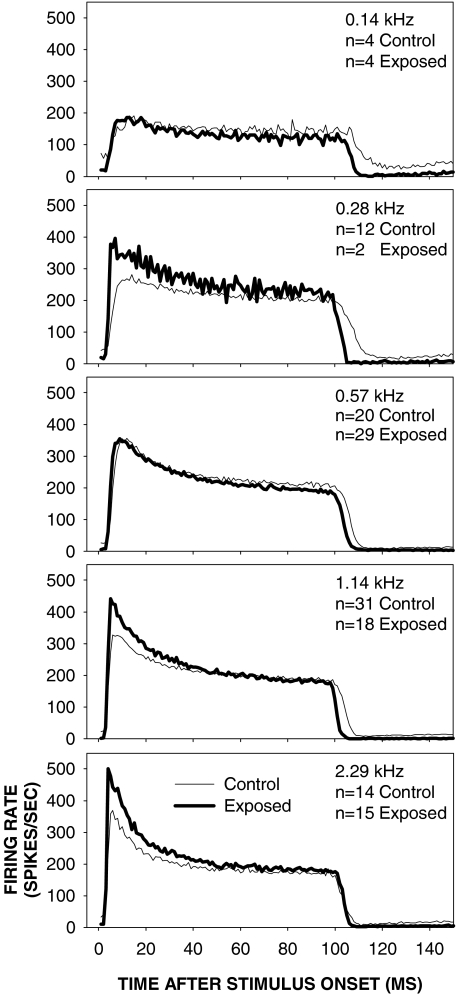
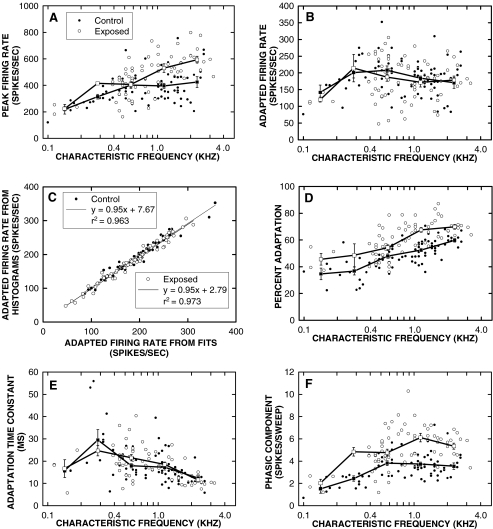
Cochlear nerve adaptation is thought to result, at least partially, from the depletion of neurotransmitter stores in hair cells. Recently, neurotransmitter vesicle pools have been identified in chick tall hair cells that might play a role in adaptation. In order to understand better the relationship between adaptation and neurotransmitter release dynamics, short-term adaptation was characterized by using peristimulus time histograms of single-unit activity in the chick cochlear nerve. The adaptation function resulting from 100-ms pure tone stimuli presented at the characteristic frequency, +20 dB relative to threshold, was well described as a single exponential decay process with an average time constant of 18.6+/-0.8 ms (mean+/-SEM). The number of spikes contributed by the adapting part of the response increased tonotopically for characteristic frequencies up to approximately 0.8 kHz. Comparison of the adaptation data with known physiological and anatomical hair cell properties suggests that depletion of the readily releasable pool is the basis of short-term adaptation in the chick. With this idea in mind, short-term adaptation was used as a proxy for assessing tall hair cell synaptic function following intense acoustic stimulation. After 48 h of exposure to an intense pure tone, the time constant of short-term adaptation was unaltered, whereas the number of spikes in the adapting component was increased at characteristic frequencies at and above the exposure frequency. These data suggest that the rate of readily releasable pool emptying is unaltered, but the neurotransmitter content of the pool is increased, by exposure to intense sound. The results imply that an increase in readily releasable pool size might be a compensatory mechanism ensuring the strength of the hair cell afferent synapse in the face of ongoing acoustic stress.
Figures


Similar articles
-
Adaptation reduces spike-count reliability, but not spike-timing precision, of auditory nerve responses.J Neurosci. 2007 Jun 13;27(24):6461-72. doi: 10.1523/JNEUROSCI.5239-06.2007. J Neurosci. 2007. PMID: 17567807 Free PMC article.
-
Evidence that rapid vesicle replenishment of the synaptic ribbon mediates recovery from short-term adaptation at the hair cell afferent synapse.J Assoc Res Otolaryngol. 2004 Dec;5(4):376-90. doi: 10.1007/s10162-004-5003-8. J Assoc Res Otolaryngol. 2004. PMID: 15675002 Free PMC article.
-
Temperature insensitivity of short-term adaptation in single-units of the chick cochlear nerve.Synapse. 2005 Dec 15;58(4):243-8. doi: 10.1002/syn.20204. Synapse. 2005. PMID: 16206182
-
Effects of periodic rest on physiological measures of auditory sensitivity following exposure to noise.J Acoust Soc Am. 1987 Oct;82(4):1265-73. doi: 10.1121/1.395829. J Acoust Soc Am. 1987. PMID: 3680783
-
Structural and functional effects of acoustic exposure in goldfish: evidence for tonotopy in the teleost saccule.BMC Neurosci. 2011 Feb 15;12:19. doi: 10.1186/1471-2202-12-19. BMC Neurosci. 2011. PMID: 21324138 Free PMC article.
Cited by
-
Adaptation reduces spike-count reliability, but not spike-timing precision, of auditory nerve responses.J Neurosci. 2007 Jun 13;27(24):6461-72. doi: 10.1523/JNEUROSCI.5239-06.2007. J Neurosci. 2007. PMID: 17567807 Free PMC article.
-
Auditory brainstem responses predict auditory nerve fiber thresholds and frequency selectivity in hearing impaired chinchillas.Hear Res. 2011 Oct;280(1-2):236-44. doi: 10.1016/j.heares.2011.06.002. Epub 2011 Jun 15. Hear Res. 2011. PMID: 21699970 Free PMC article.
-
Age-related hearing loss is associated with alterations in temporal envelope processing in different neural generators along the auditory pathway.Front Neurol. 2022 Aug 5;13:905017. doi: 10.3389/fneur.2022.905017. eCollection 2022. Front Neurol. 2022. PMID: 35989932 Free PMC article.
-
Rapid neural adaptation to sound level statistics.J Neurosci. 2008 Jun 18;28(25):6430-8. doi: 10.1523/JNEUROSCI.0470-08.2008. J Neurosci. 2008. PMID: 18562614 Free PMC article.
-
Noise-induced hearing loss alters the temporal dynamics of auditory-nerve responses.Hear Res. 2010 Oct 1;269(1-2):23-33. doi: 10.1016/j.heares.2010.07.009. Epub 2010 Aug 7. Hear Res. 2010. PMID: 20696230 Free PMC article.
References
-
- {'text': '', 'ref_index': 1, 'ids': [{'type': 'DOI', 'value': '10.1016/0378-5955(94)90160-0', 'is_inner': False, 'url': 'https://doi.org/10.1016/0378-5955(94)90160-0'}, {'type': 'PubMed', 'value': '7737920', 'is_inner': True, 'url': 'https://pubmed.ncbi.nlm.nih.gov/7737920/'}]}
- Chen L, Salvi R, Shero M. Cochlear frequency-place map in adult chickens: intracellular biocytin labeling. Hear. Res. 81:130–136, 1994. - PubMed
-
- {'text': '', 'ref_index': 1, 'ids': [{'type': 'DOI', 'value': '10.1002/syn.20204', 'is_inner': False, 'url': 'https://doi.org/10.1002/syn.20204'}, {'type': 'PubMed', 'value': '16206182', 'is_inner': True, 'url': 'https://pubmed.ncbi.nlm.nih.gov/16206182/'}]}
- Crumling MA, Saunders JC. Temperature insensitivity of short-term adaptation in single-units of the chick cochlear nerve. Synapse 58:243–248, 2005. - PubMed
-
- {'text': '', 'ref_index': 1, 'ids': [{'type': 'DOI', 'value': '10.1152/jn.01130.2003', 'is_inner': False, 'url': 'https://doi.org/10.1152/jn.01130.2003'}, {'type': 'PubMed', 'value': '14749306', 'is_inner': True, 'url': 'https://pubmed.ncbi.nlm.nih.gov/14749306/'}]}
- Eisen MD, Spassova M, Parsons TD. Large releasable pool of synaptic vesicles in chick cochlear hair cells. J. Neurophysiol. 91:2422–2428, 2004. - PubMed
-
- {'text': '', 'ref_index': 1, 'ids': [{'type': 'DOI', 'value': '10.1016/0378-5955(92)90048-R', 'is_inner': False, 'url': 'https://doi.org/10.1016/0378-5955(92)90048-r'}, {'type': 'PubMed', 'value': '1526890', 'is_inner': True, 'url': 'https://pubmed.ncbi.nlm.nih.gov/1526890/'}]}
- Fischer FP. Quantitative analysis of the innervation of the chicken basilar papilla. Hear. Res. 61:167–178, 1992. - PubMed
-
- {'text': '', 'ref_index': 1, 'ids': [{'type': 'DOI', 'value': '10.1073/pnas.95.12.7127', 'is_inner': False, 'url': 'https://doi.org/10.1073/pnas.95.12.7127'}, {'type': 'PMC', 'value': 'PMC22763', 'is_inner': False, 'url': 'https://pmc.ncbi.nlm.nih.gov/articles/PMC22763/'}, {'type': 'PubMed', 'value': '9618550', 'is_inner': True, 'url': 'https://pubmed.ncbi.nlm.nih.gov/9618550/'}]}
- Fridberger A, Flock A, Ulfendahl M, Flock B. Acoustic overstimulation increases outer hair cell Ca2+ concentrations and causes dynamic contractions of the hearing organ. Proc. Natl. Acad. Sci. USA. 95:7127–7132, 1998. - PMC - PubMed
Publication types
MeSH terms
Grants and funding
LinkOut - more resources
Full Text Sources
Medical
Miscellaneous
