. 2007 Apr 1;403(1):207-15.
doi: 10.1042/BJ20061530.

Quaternary structure and biochemical properties of mycobacterial RNase E/G

Affiliations

Quaternary structure and biochemical properties of mycobacterial RNase E/G

Mirijam-Elisabeth Zeller et al. Biochem J. .

Abstract

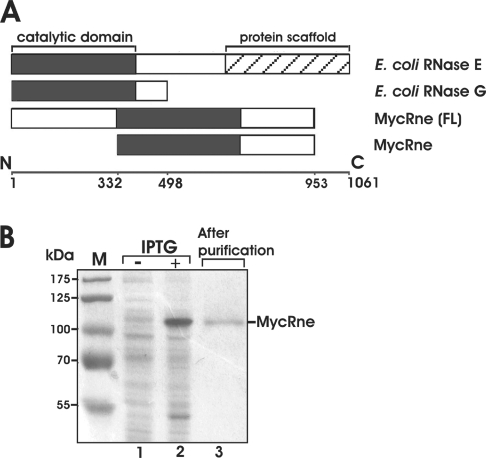
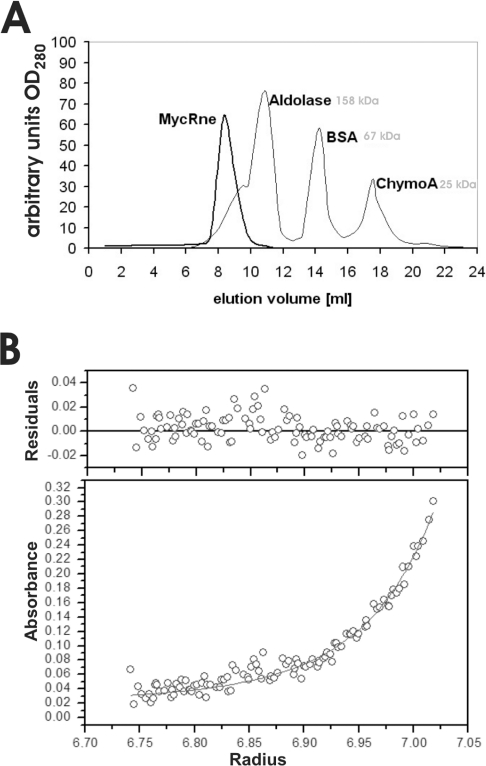
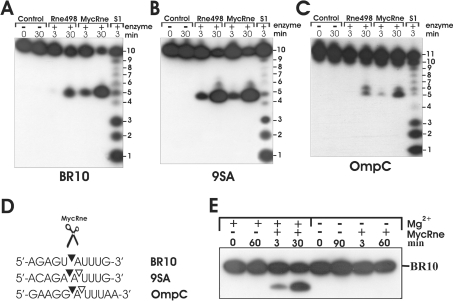
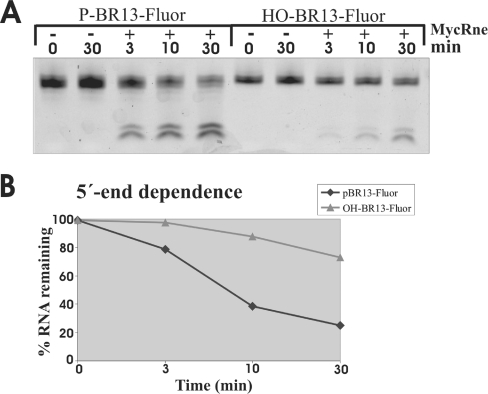
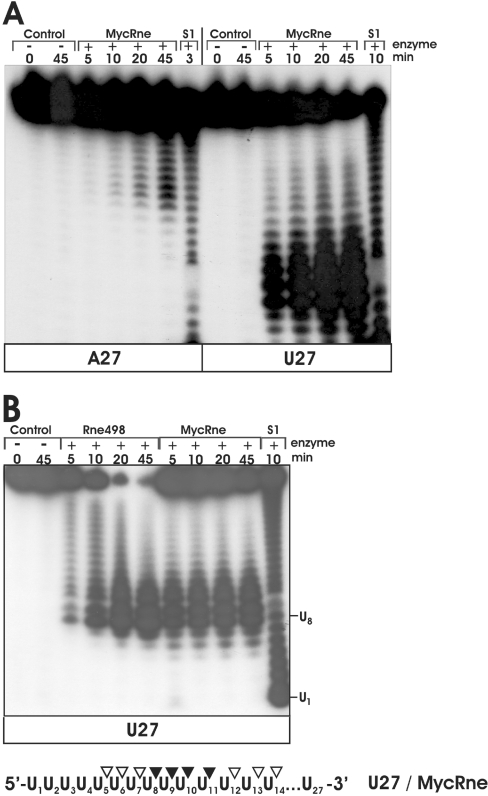
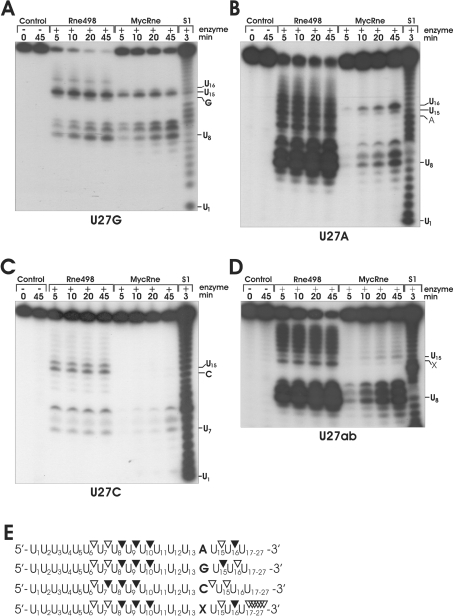
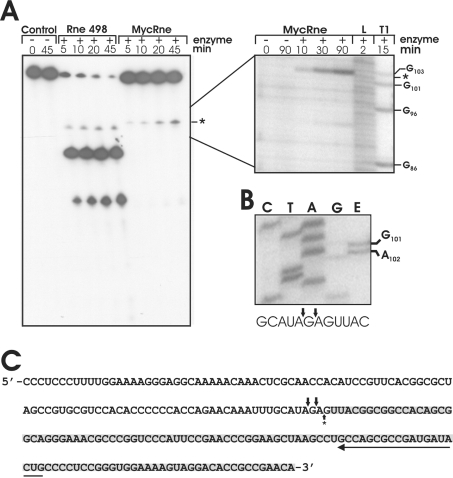
The RNase E/G family of endoribonucleases plays the central role in numerous post-transcriptional mechanisms in Escherichia coli and, presumably, in other bacteria, including human pathogens. To learn more about specific properties of RNase E/G homologues from pathogenic Gram-positive bacteria, a polypeptide comprising the catalytic domain of Mycobacterium tuberculosis RNase E/G (MycRne) was purified and characterized in vitro. In the present study, we show that affinity-purified MycRne has a propensity to form dimers and tetramers in solution and possesses an endoribonucleolytic activity, which is dependent on the 5'-phosphorylation status of RNA. Our data also indicate that the cleavage specificities of the M. tuberculosis RNase E/G homologue and its E. coli counterpart are only moderately overlapping, and reveal a number of sequence determinants within MycRne cleavage sites that differentially affect the efficiency of cleavage. Finally, we demonstrate that, similar to E. coli RNase E, MycRne is able to cleave in an intercistronic region of the putative 9S precursor of 5S rRNA, thus suggesting a common function for RNase E/G homologues in rRNA processing.


Figures

Figure 1
Figure 1. Purification of MycRne
(A) Primary structures of E. coli and M. tuberculosis RNase E/G homologues. The evolutionarily conserved minimal catalytic domain [43] is shown by black boxes in the full-length E. coli RNase E, RNase G and M. tuberculosis RNase E/G [MycRne (FL)] polypeptides as well as in the N-terminally truncated form of M. tuberculosis RNase E/G (MycRne) used in the present study. The ‘protein scaffold’ region (hatched box) of E. coli RNase E (residues 688–1061) [13] is the location of the binding sites for the major components of the degradosome (enolase, RhlB RNA helicase and PNPase). (B) Purification of MycRne. Affinity-purified mycobacterial MycRne, as well as protein extracts prepared from BL21(DE3) cells harbouring the MycRne-coding plasmid before (−) and after (+) addition of IPTG respectively, were analysed in SDS/10% polyacrylamide gels followed by Coomassie Blue staining. Indicated are the positions of M. tuberculosis RNase E/G (MycRne) and the molecular-mass markers (in kDa; lane M).
Figure 2
Figure 2. Quaternary structure of RNase E/G
(A) Gel filtration of MycRne. Affinity-purified MycRne (thicker line) was analysed by size-exclusion chromatography using a 25 ml Superose® 12 HR 10/30 column (Amersham Biosciences) connected to an FPLC system. The column was calibrated with aldolase (158 kDa), BSA (67 kDa) and chymotrypsinogen A (25 kDa) (thinner line). Elution profiles were recorded online; the absorbance at 280 nm is indicated on the y-axis, whereas elution volumes are indicated on the x-axis. (B) Sedimentation equilibrium analysis. A representative radial concentration distribution of RNase E/G at 16 μM is shown after reaching equilibrium (18 h) at 12000 rev./min at 20 °C. The lower panel plots the absorbance at 292 nm against the radial position (cm). The absorbance offset was set to 0.022 absorbance unit. The best fit of the data set (six speeds, 1502 points) was consistent at this sample concentration with a monomer–dimer equilibrium (solid lines) with a Kd of 1.8 μM. Residual values between experimental data and a self-associating model of ideal species (molecular mass, 71100 Da) are shown in the upper panel.
Figure 3
Figure 3. Cleavage patterns of oligonucleotides BR10, 9SA and OmpC
Each 5′-end-labelled oligonucleotide (A, B and C respectively) was incubated without enzyme (control), affinity-purified E. coli RNase E (Rne498) or M. tuberculosis RNase E/G (MycRne), and aliquots withdrawn at the times indicated above each lane were analysed on 20% polyacrylamide/urea gels. Lanes S1, 1 nt ladder generated by partial digestion of BR10, 9SA or OmpC with S1 nuclease respectively. The sequence of BR10, 9SA and OmpC is shown in (D). The internucleotide bonds that are sensitive to MycRne cleavage are indicated by triangles. Filled triangles point towards the bonds that have higher sensitivity to the endonucleolytic activity of MycRne. (E) Magnesium-dependence of MycRne cleavages. BR10 was incubated with MycRne in the absence (−) or presence (+) of Mg2+ ions, and aliquots withdrawn at times indicated above each lane were analysed on a 15% sequencing gel. Each assay was repeated at least twice, and one representative gel image is shown.
Figure 4
Figure 4. 5′-end-dependence of MycRne cleavages
(A) Relative efficiency of MycRne cleavage of fluorescently labelled 5′-phosphorylated and non-phosphorylated oligonucleotides (P-BR13-Fluor and HO-BR13-Fluor respectively). Each oligonucleotide (∼5 pmol) was incubated without (control) or with affinity-purified MycRne, and aliquots withdrawn at the times indicated above each lane were analysed on a 15% (w/v) sequencing gel. The signals corresponding to the fluorescently labelled oligonucleotides and their products of cleavage were visualized using a PhosphorImager (Typhoon 8600, Molecular Dynamics) and quantified further employing ImageQuant software. (B) Graphical representation of uncleaved RNA (%) plotted as a function of time (min) indicates that MycRne cleaves the 5′-phosphorylated substrate faster than the non-phosphorylated one. The graph represents the data from one single experiment, which was repeated twice with similar results.
Figure 5
Figure 5. Comparative cleavage of A27 and U27 by MycRne
(A) 5′-End-labelled A27 (left) or U27 (right) were incubated without enzyme (control) or with 1.5–0.3 μg of native M. tuberculosis RNase E/G (MycRne), and aliquots withdrawn at the times indicated above each lane were analysed on 15% polyacrylamide/urea gels. The 1 nt ladders (lanes S1) were generated by partial digestion of A27 and U27 with S1 nuclease respectively. Each experiment was repeated at least twice, and one representative gel image is shown. (B) Cleavage patterns of U27 generated by of Rne498 and MycRne. 5′-End-labelled U27 was incubated without enzyme (control), with E. coli RNase E (Rne498) or with M. tuberculosis RNase E/G (MycRne), and aliquots withdrawn at the times indicated above each lane were analysed on a 15% polyacrylamide/urea gel. Lane S1, a 1 nt ladder prepared by partial digestion of U27 with S1 nuclease. The co-ordinates of U1 and U8 within U27 are indicated. Internucleotide bonds with a moderate (open triangles) or high (closed triangles) sensitivity to MycRne cleavage are indicated in a schematic view of U27 shown at the bottom. Each experiment was repeated at least twice, and one representative gel image is shown.
Figure 6
Figure 6. Cleavage patterns of U27A, U27G, U27C and U27ab generated by Rne498 and MycRne
Each 5′-end-labelled substrate derived from U27 by replacement of the U at position 14 by a G (U27G) (A), A (U27A) (B), C (U27C) (C) or abasic (U27ab) (D) residue was incubated without enzyme (control), with E. coli RNase E (Rne498) or with M. tuberculosis RNase E/G (MycRne), and aliquots withdrawn at the times indicated above each lane were analysed on 15% polyacrylamide/urea gels. Indicated are the positions of several nucleotides including the substituted base [A, G, C or the abasic residue (X) respectively] as well as site(s) sensitive to MycRne cleavage. Lanes S1, 1 nt ladders generated by partial digestion of each oligonucleotide with S1. Similar patterns were obtained for each substrate in three independent experiments. (E) Schematic views of the substrates. The internucleotide bonds with a moderate and high susceptibility to MycRne cleavage are depicted by open and closed triangles respectively.
Figure 7
Figure 7. 9S RNA processing in vitro and in vivo
(A) 5′-End-labelled mycobacterial 9S RNA was incubated without enzyme (control), with E. coli RNase E (Rne498) or with M. tuberculosis RNase E/G (MycRne). Aliquots were withdrawn at the times indicated above each lane and analysed on 10% polyacrylamide/urea gels. The position of the M. tuberculosis RNase E/G cleavage site (*) was determined employing concomitantly run partial alkaline (L) and RNase T1 (T1) digests of the same transcript shown on the right. The experiment was repeated three times with similar results. (B) Primer-extension analysis of total mycobacterial RNA (lane E) was performed using a 5′-32P-labelled primer specific for 5S rRNA. The 5′-end of the in vivo processed 5S rRNA was determined by employing a concomitantly run sequencing ladder (lanes C, T, A and G) generated with the same primer (for details, see the Materials and methods section). The experiment was repeated twice with similar results. (C) The sequence of M. tuberculosis 5S rRNA (highlighted with grey shading) and its 5′-end-flanking region. A long horizontal arrow shows the direction and position of the primer used for primer extension. The position of in vitro (A) and in vivo (B) MycRne cleavage sites that were mapped close to the 5′ end of 5S rRNA are indicated by a single upward and two downward arrows respectively.

References

    1. Cohen S. N., McDowall K. J. RNase E: still a wonderfully mysterious enzyme. Mol. Microbiol. 1997;23:1099–1106. - PubMed
    1. Coburn G. A., Mackie G. A. Degradation of mRNA in Escherichia coli: an old problem with some new twists. Prog. Nucleic Acids Res. Mol. Biol. 1999;62:55–108. - PubMed
    1. Régnier P., Arraiano C. M. Degradation of mRNA in bacteria: emergence of ubiquitous features. BioEssays. 2000;22:235–244. - PubMed
    1. Kushner S. R. mRNA decay in Escherichia coli comes of age. J. Bacteriol. 2002;184:4658–4665. - PMC - PubMed
    1. Deana A., Belasco J. G. The function of RNase G in Escherichia coli is constrained by its amino and carboxyl termini. Mol. Microbiol. 2004;51:1205–1217. - PubMed

Publication types

MeSH terms