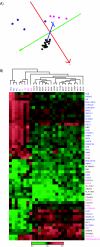
Gene expression profiles of primary colorectal carcinomas, liver metastases, and carcinomatoses
- PMID: 17201907
- PMCID: PMC1770935
- DOI: 10.1186/1476-4598-6-2
Gene expression profiles of primary colorectal carcinomas, liver metastases, and carcinomatoses
Abstract
Background: Despite the fact that metastases are the leading cause of colorectal cancer deaths, little is known about the underlying molecular changes in these advanced disease stages. Few have studied the overall gene expression levels in metastases from colorectal carcinomas, and so far, none has investigated the peritoneal carcinomatoses by use of DNA microarrays. Therefore, the aim of the present study is to investigate and compare the gene expression patterns of primary carcinomas (n = 18), liver metastases (n = 4), and carcinomatoses (n = 4), relative to normal samples from the large bowel.
Results: Transcriptome profiles of colorectal cancer metastases independent of tumor site, as well as separate profiles associated with primary carcinomas, liver metastases, or peritoneal carcinomatoses, were assessed by use of Bayesian statistics. Gains of chromosome arm 5p are common in peritoneal carcinomatoses and several candidate genes (including PTGER4, SKP2, and ZNF622) mapping to this region were overexpressed in the tumors. Expression signatures stratified on TP53 mutation status were identified across all tumors regardless of stage. Furthermore, the gene expression levels for the in vivo tumors were compared with an in vitro model consisting of cell lines representing all three tumor stages established from one patient.
Conclusion: By statistical analysis of gene expression data from primary colorectal carcinomas, liver metastases, and carcinomatoses, we are able to identify genetic patterns associated with the different stages of tumorigenesis.
Figures


Similar articles
-
Genome characteristics of primary carcinomas, local recurrences, carcinomatoses, and liver metastases from colorectal cancer patients.Mol Cancer. 2004 Feb 23;3:6. doi: 10.1186/1476-4598-3-6. Mol Cancer. 2004. PMID: 14977426 Free PMC article.
-
Gene expression profiling of colorectal cancer and metastases divides tumours according to their clinicopathological stage.J Pathol. 2004 Sep;204(1):65-74. doi: 10.1002/path.1606. J Pathol. 2004. PMID: 15307139
-
Expression of an ASCL2 related stem cell signature and IGF2 in colorectal cancer liver metastases with 11p15.5 gain.Gut. 2010 Sep;59(9):1236-44. doi: 10.1136/gut.2009.195701. Epub 2010 May 17. Gut. 2010. PMID: 20479215
-
Heterogeneity within and between primary colorectal carcinomas and matched metastases as revealed by analysis of Ki-ras and p53 mutations.Biochem Biophys Res Commun. 2004 Dec 17;325(3):784-91. doi: 10.1016/j.bbrc.2004.10.111. Biochem Biophys Res Commun. 2004. PMID: 15541358 Clinical Trial.
-
Genomics and proteomics approaches for biomarker discovery in sporadic colorectal cancer with metastasis.Cancer Genomics Proteomics. 2013 Jan-Feb;10(1):19-25. Cancer Genomics Proteomics. 2013. PMID: 23382583 Review.
Cited by
-
A network of genes antagonistic to the LIN-35 retinoblastoma protein of Caenorhabditis elegans.Genetics. 2012 Aug;191(4):1367-80. doi: 10.1534/genetics.112.140152. Epub 2012 Apr 27. Genetics. 2012. PMID: 22542970 Free PMC article.
-
New insights into KLFs and SOXs in cancer pathogenesis, stemness, and therapy.Semin Cancer Biol. 2023 May;90:29-44. doi: 10.1016/j.semcancer.2023.02.003. Epub 2023 Feb 15. Semin Cancer Biol. 2023. PMID: 36806560 Free PMC article. Review.
-
Cyclin A2 confers cisplatin resistance to endometrial carcinoma cells via up-regulation of an Akt-binding protein, periplakin.J Cell Mol Med. 2010 Sep;14(9):2305-17. doi: 10.1111/j.1582-4934.2009.00839.x. J Cell Mol Med. 2010. PMID: 19583808 Free PMC article.
-
Omics analyses in peritoneal metastasis-utility in the management of peritoneal metastases from colorectal cancer and pseudomyxoma peritonei: a narrative review.J Gastrointest Oncol. 2021 Apr;12(Suppl 1):S191-S203. doi: 10.21037/jgo-20-136. J Gastrointest Oncol. 2021. PMID: 33968437 Free PMC article. Review.
-
A comparison of colorectal cancer in Nigerian and North American patients: is the cancer biology different?Surgery. 2014 Aug;156(2):305-10. doi: 10.1016/j.surg.2014.03.036. Epub 2014 Jun 19. Surgery. 2014. PMID: 24953266 Free PMC article.
References
-
- The Cancer Registry of Norway http://www.kreftregisteret.no Accessed 2006.
-
- Perou CM, Sorlie T, Eisen MB, van de RM, Jeffrey SS, Rees CA, Pollack JR, Ross DT, Johnsen H, Akslen LA, Fluge O, Pergamenschikov A, Williams C, Zhu SX, Lonning PE, Borresen-Dale AL, Brown PO, Botstein D. Molecular portraits of human breast tumors. Nature. 2000;406:747–752. doi: 10.1038/35021093. - DOI - PubMed
MeSH terms
LinkOut - more resources
Full Text Sources
Other Literature Sources
Medical
Research Materials
Miscellaneous

