. 2007 Mar 9;282(10):7710-22.
doi: 10.1074/jbc.M610824200. Epub 2007 Jan 3.

The glucose transporter 4-regulating protein TUG is essential for highly insulin-responsive glucose uptake in 3T3-L1 adipocytes

Affiliations

The glucose transporter 4-regulating protein TUG is essential for highly insulin-responsive glucose uptake in 3T3-L1 adipocytes

Chenfei Yu et al. J Biol Chem. .

Abstract

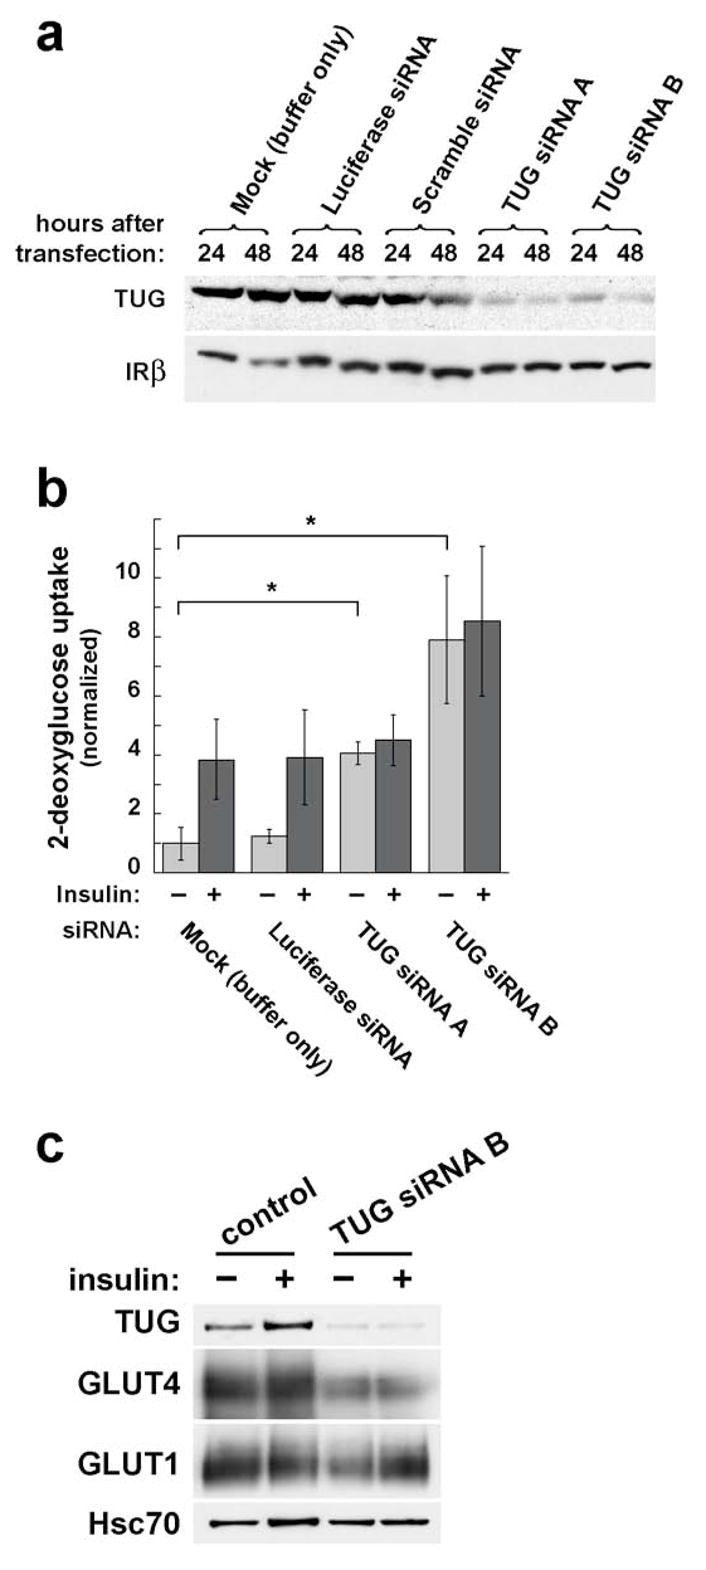
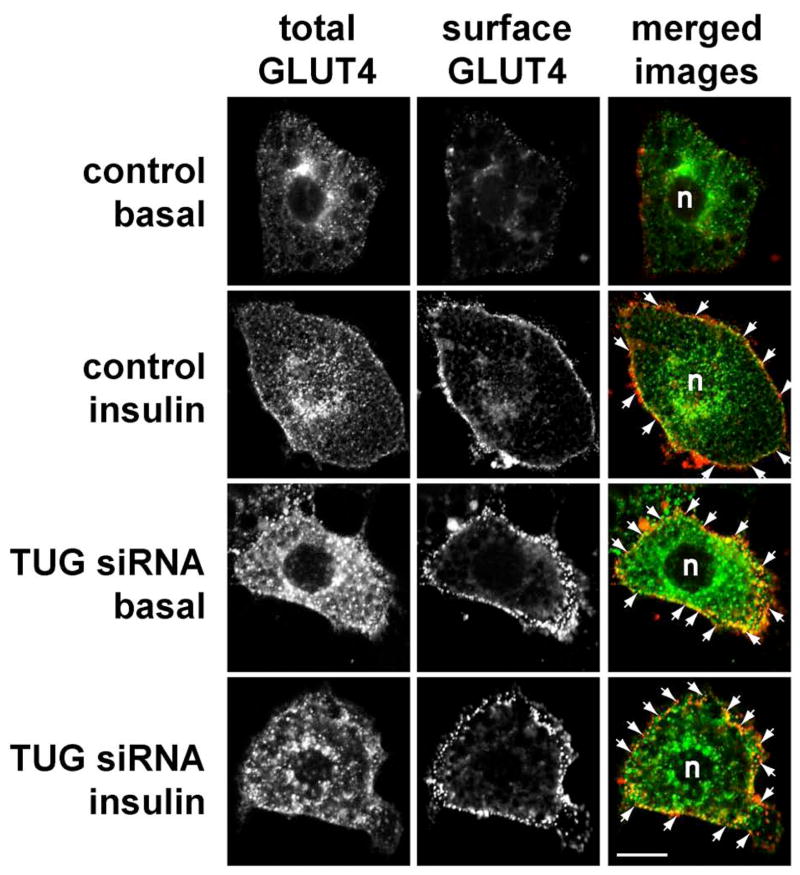
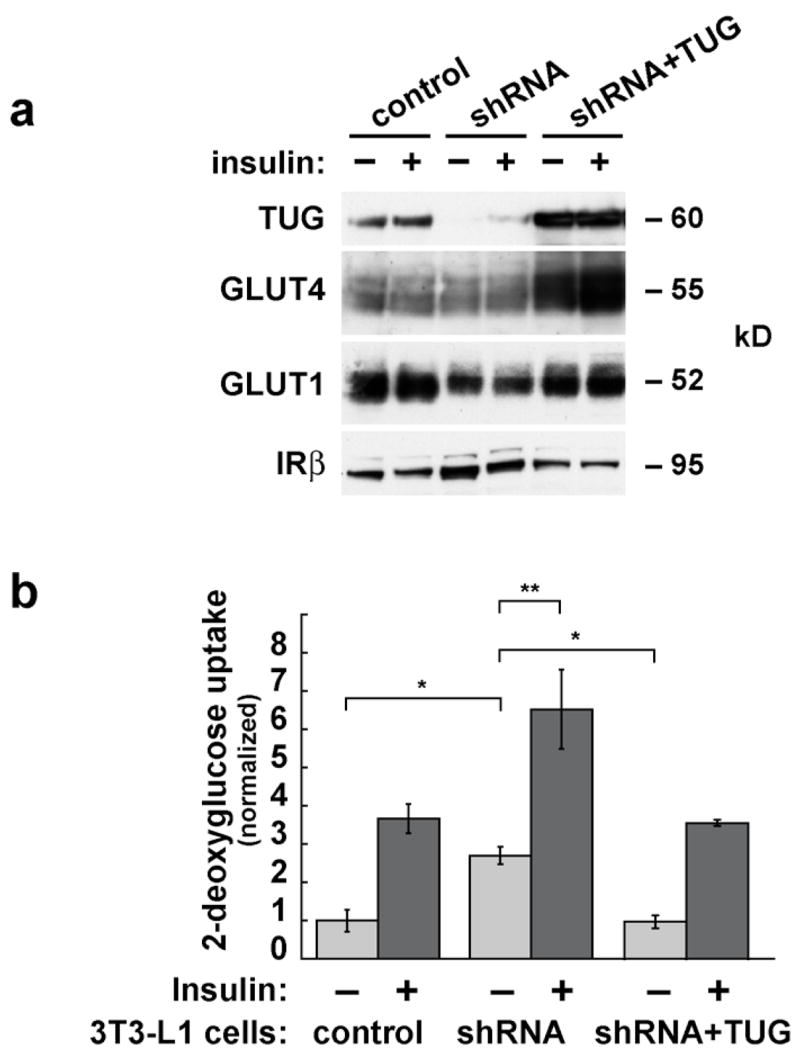
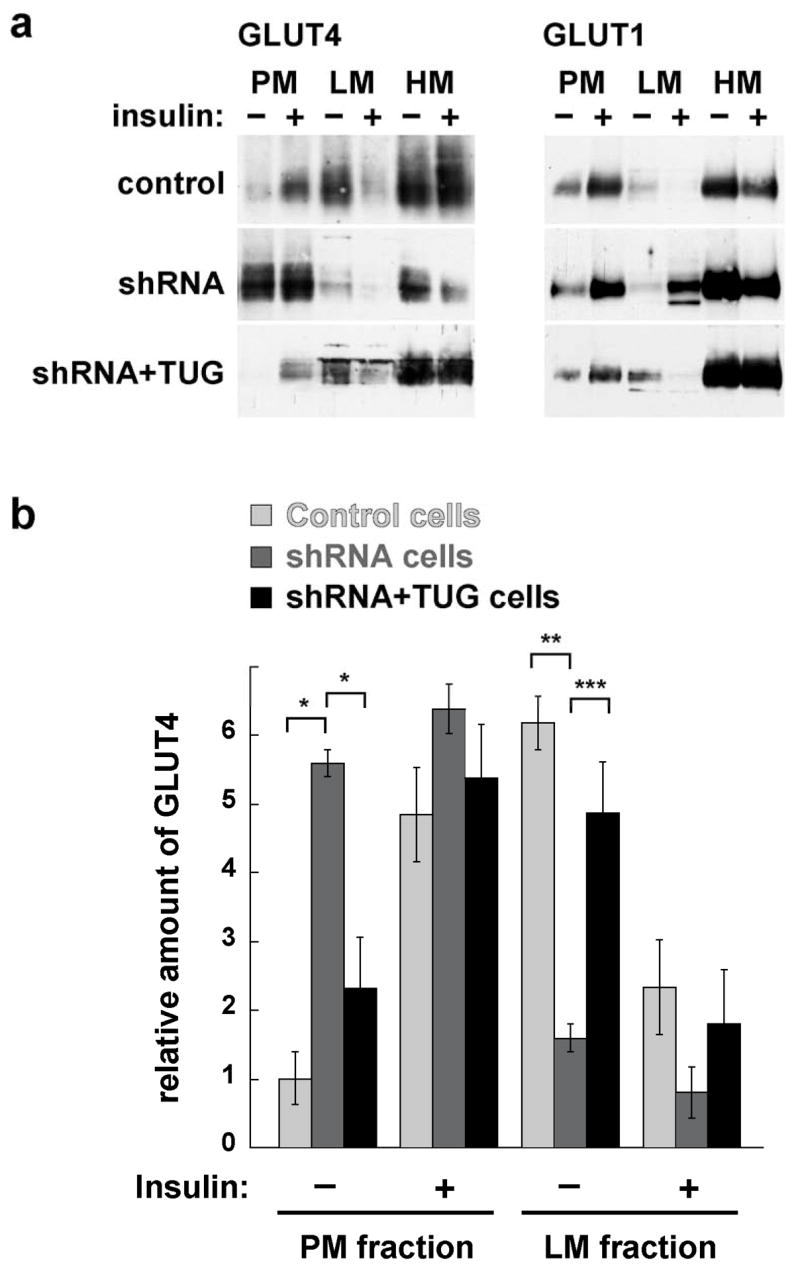
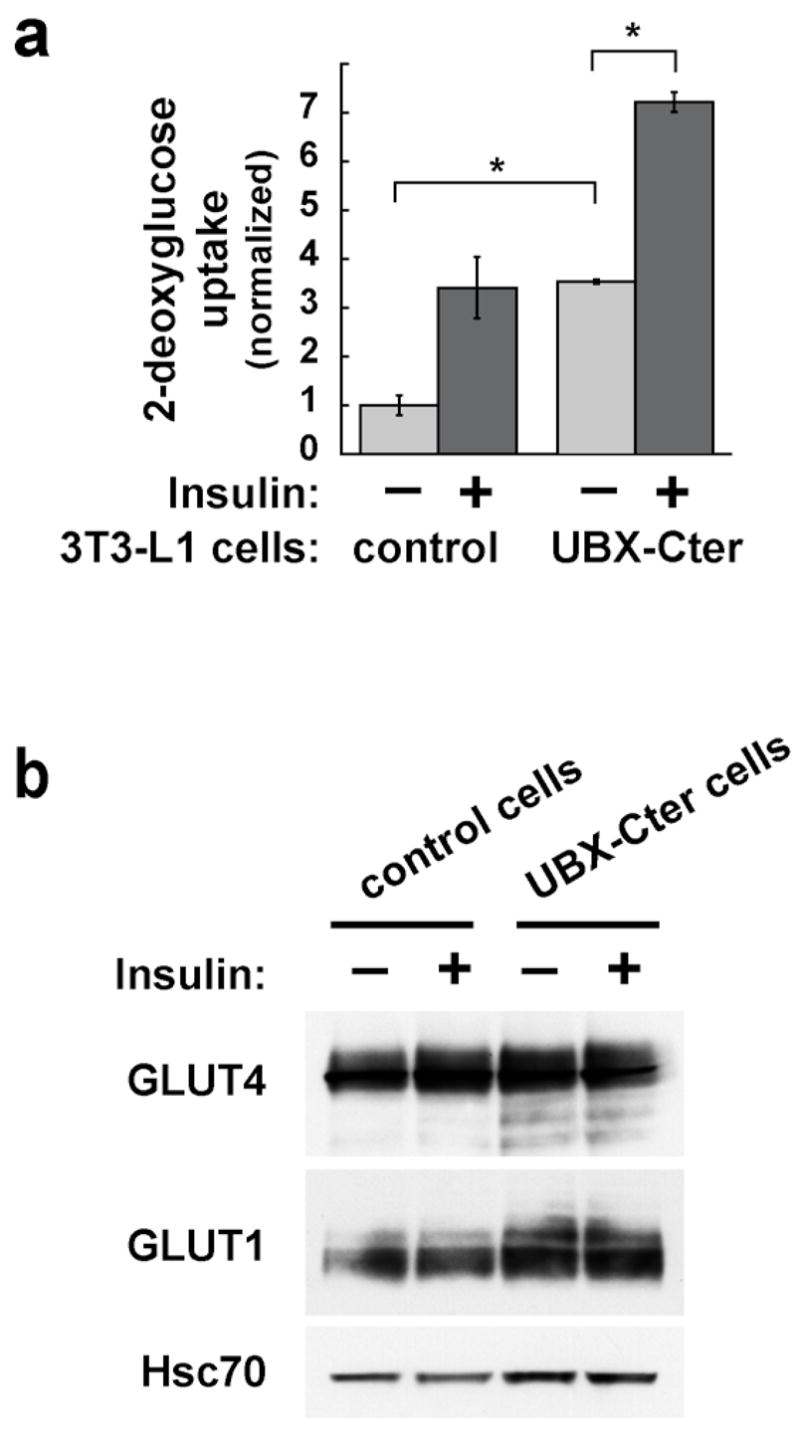
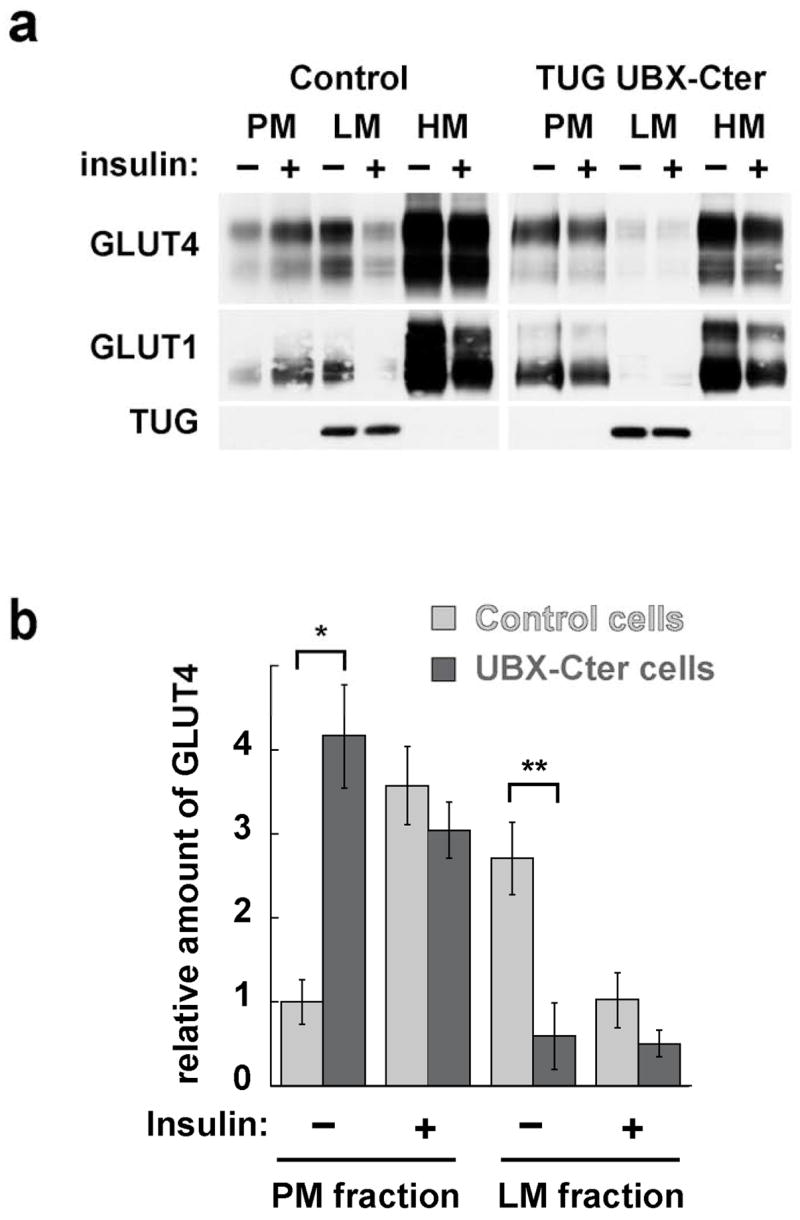
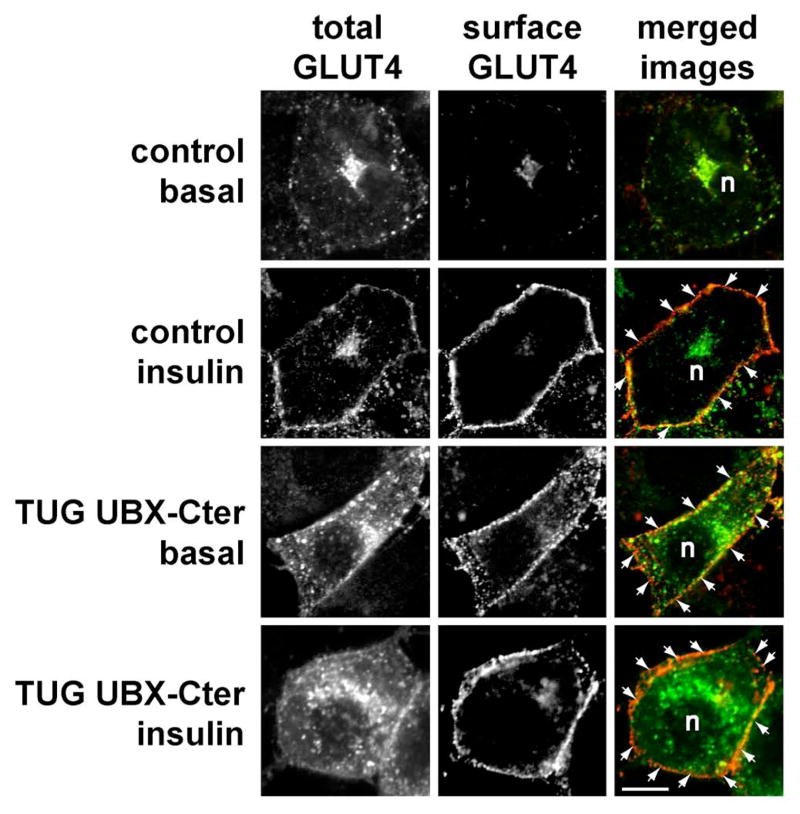
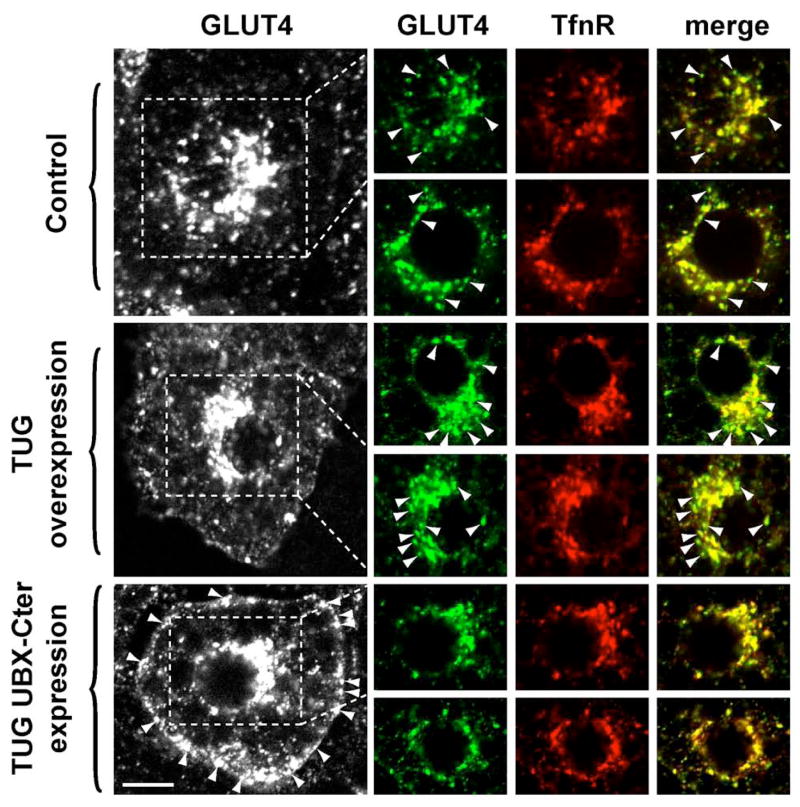
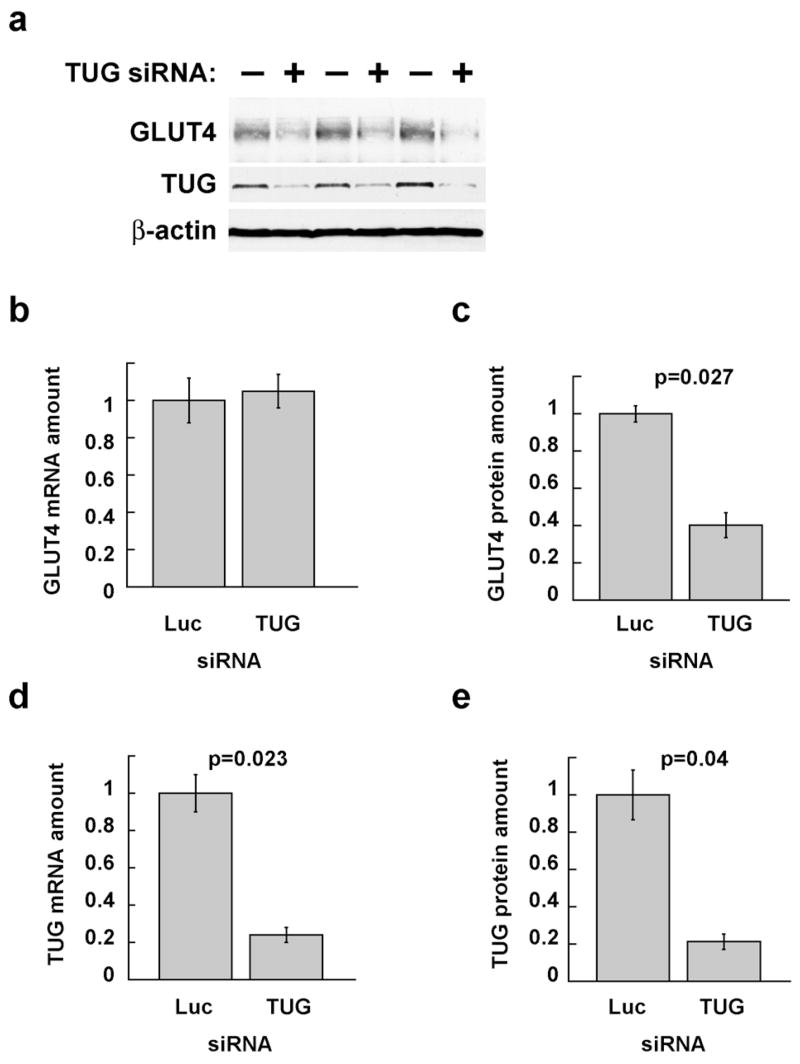
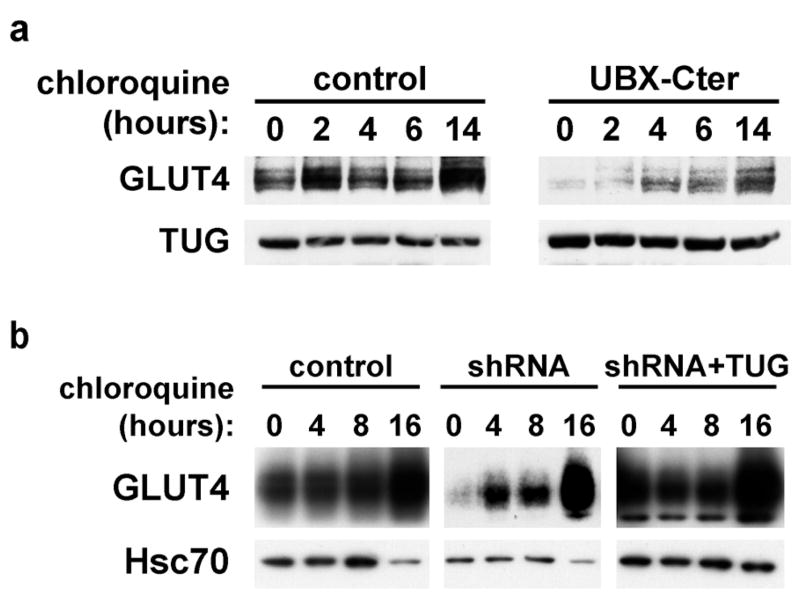
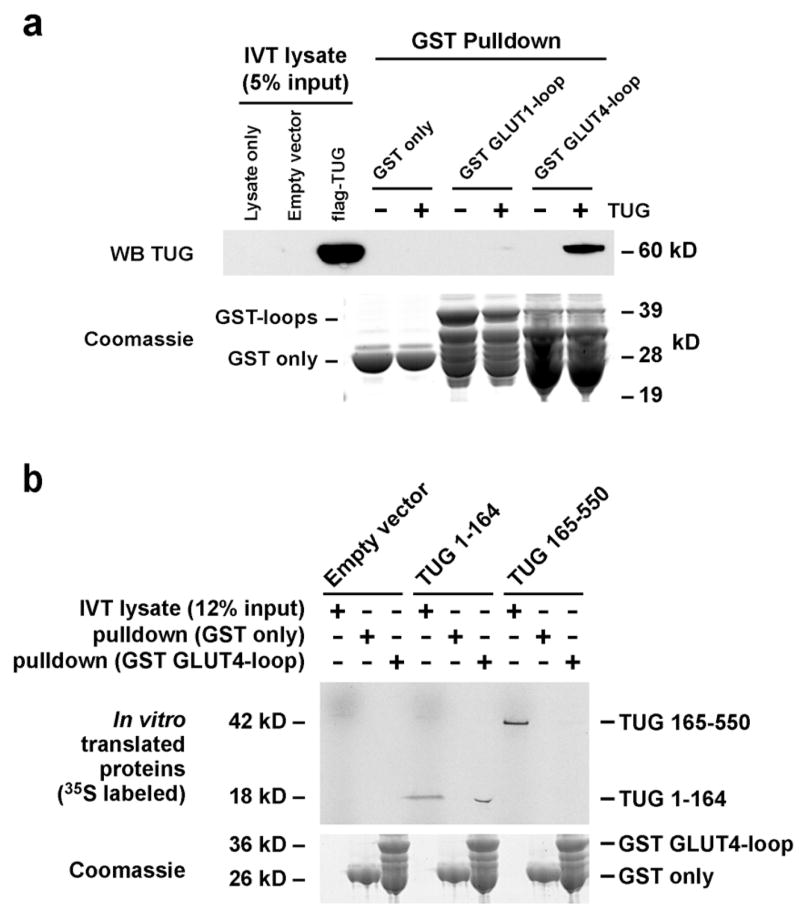
Insulin stimulates glucose uptake in fat and muscle by redistributing GLUT4 glucose transporters from intracellular membranes to the cell surface. We previously proposed that, in 3T3-L1 adipocytes, TUG retains GLUT4 within unstimulated cells and insulin mobilizes this retained GLUT4 by stimulating its dissociation from TUG. Yet the relative importance of this action in the overall control of glucose uptake remains uncertain. Here we report that transient, small interfering RNA-mediated depletion of TUG causes GLUT4 translocation and enhances glucose uptake in unstimulated 3T3-L1 adipocytes, similar to insulin. Stable TUG depletion or expression of a dominant negative fragment likewise stimulates GLUT4 redistribution and glucose uptake, and insulin causes a 2-fold further increase. Microscopy shows that TUG governs the accumulation of GLUT4 in perinuclear membranes distinct from endosomes and indicates that it is this pool of GLUT4 that is mobilized by TUG disruption. Interestingly, in addition to translocating GLUT4 and enhancing glucose uptake, TUG disruption appears to accelerate the degradation of GLUT4 in lysosomes. Finally, we find that TUG binds directly and specifically to a large intracellular loop in GLUT4. Together, these findings demonstrate that TUG is required to retain GLUT4 intracellularly in 3T3-L1 adipocytes in the absence of insulin and further implicate the insulin-stimulated dissociation of TUG and GLUT4 as an important action by which insulin stimulates glucose uptake.


Figures

Figure 1
Figure 1
Effect of transient, siRNA-mediated TUG depletion on glucose uptake. a. 3T3-L1 adipocytes were electroporated with synthetic siRNA duplexes as indicated. 24 or 48 h after transfection, cells were lysed and analyzed by SDS-PAGE and immunoblotting. Control transfections include a mock electroporation with buffer only, an siRNA duplex targeting luciferase (which is not present in the cells), and a scrambled siRNA duplex targeting no known gene. Immunoblots were done to detect TUG and, as a control, insulin receptor β chain. The experiment was performed twice with similar results. b. 3T3-L1 adipocytes were transfected with the indicated siRNA duplexes, then seeded to multiwell plates. 48 h after transfection, glucose uptake assays were performed. Counts of [3H]-2-deoxyglucose were normalized to the amounts of protein present in the wells, and are plotted relative to uptake in unstimulated control cells. Error bars show standard deviation (* indicates p=0.02). The experiment was performed four times with similar results. c. 3T3-L1 adipocytes were transfected with or without TUG siRNA duplex B, then immunoblots were performed to assess the amounts of GLUT4 or GLUT1 present. Lysates were made 48 h after transfection of the siRNA, and basal and insulin stimulated cells (similar to those used in glucose uptake experiments) were assayed. Lysates were immunoblotted to detect Hsc70, a heat shock protein, as a loading control. The experiment was repeated twice using cells with (as here) or without a tagged GLUT4 reporter, with no effect on the result.
Figure 2
Figure 2
Effect of siRNA-mediated TUG depletion on GLUT4 distribution. a. 3T3-L1 adipocytes stably expressing a myc- and GFP-tagged GLUT4 protein (ref. 13) were electroporated with luciferase siRNA (control) or with siRNA duplex B (TUG siRNA), then seeded to coverslips. 48 h after transfection, cells were starved, treated with or without 160 nM insulin for 15 min., then chilled to 4°C and stained to detect externalized myc epitope. Images were acquired by confocal microscopy of GFP (total GLUT4) and myc epitope (surface GLUT4). GLUT4 present at the plasma membrane is highlighted by arrows; n indicates the position of the nuclei. Scale bar, 10 μm. Similar results were obtained in two independent experiments.
Figure 3
Figure 3
Effects of stable shRNA-mediated TUG depletion on glucose uptake. a. TUG was depleted stably in 3T3-L1 cells using a shRNA-producing retrovirus to make “shRNA cells”. Wildtype, shRNA-resistant TUG was expressed stably in the shRNA cells using a second retrovirus to make “shRNA+TUG cells”. Homogeneous populations of cells were isolated by flow sorting, and adipose differentiation was induced. Control, shRNA, and shRNA+TUG 3T3-L1 adipocytes were analyzed by immunoblotting to demonstrate depletion and reintroduction of TUG, and to assess relative amounts of GLUT4 and GLUT1. Insulin receptor β chain is immunoblotted as a loading control. b. Control, shRNA, and shRNA+TUG 3T3-L1 adipocytes were differentiated on multiwell plates, and glucose uptake assays were performed. Counts of [3H]-2-deoxyglucose were normalized to the amounts of protein present in the wells, and are plotted relative to the uptake in unstimulated control cells. Error bars show standard deviation (* indicates p<0.002; ** indicates p<0.01). For each part of the figure, consistent results were obtained in three independent experiments.
Figure 4
Figure 4
Effects of shRNA-mediated TUG depletion on GLUT4 and GLUT1 distribution. a. Control, shRNA, and shRNA+TUG 3T3-L1 adipocytes were treated with insulin as indicated. Cells were homogenized and plasma membrane (PM), light microsome (LM), and heavy microsome (HM) fractions were isolated. Equal amounts of protein from each fraction were analyzed by immunoblotting to detect GLUT4 and GLUT1, as indicated. b. PM and LM GLUT4 from four independent fractionation experiments, each similar to that shown in part (a), were quantified by densitometry. Error bars show standard error. * indicates p<0.0006, ** indicates p<0.006, and *** indicates p<0.04.
Figure 5
Figure 5
Effects of UBX-Cter, a dominant negative TUG protein fragment, on glucose uptake. a. 3T3-L1 adipocytes stably expressing UBX-Cter and control cells were differentiated in multiwell plates and used for glucose uptake experiments. Counts of [3H]-2-deoxyglucose were normalized to the amounts of protein present in the wells, and are plotted relative to the uptake in unstimulated control cells. Error bars show standard deviation (* indicates p<0.0001). Similar results were obtained in four independent experiments. b. Immunoblots of cell lysates from the glucose uptake assay were done to assess the relative amounts of GLUT4 and GLUT1. Hsc70 is immunoblotted as a loading control. The experiment was repeated twice with consistent results.
Figure 6
Figure 6
Effects of UBX-Cter on GLUT4 and GLUT1 distribution in 3T3-L1 adipocytes. a. Plasma membrane (PM), light microsome (LM), and heavy microsome (HM) fractions were purified from basal and insulin stimulated cells containing UBX-Cter, and from control cells. All cells contained the GLUT4-7myc-GFP reporter protein. Immunoblots were performed on equal amounts of each fraction to detect the GLUT4 reporter and endogenous TUG (top panels), GLUT1 (middle panels), and TUG (bottom panels). b. PM and LM GLUT4 from four independent fractionation experiments, each similar to that shown in part (a), were quantified by densitometry. Error bars show standard error. * indicates p<0.007, ** indicates p<0.001.
Figure 7
Figure 7
Effect of UBX-Cter on GLUT4 distribution. Control and UBX-Cter expressing 3T3-L1 adipocytes containing a myc- and GFP-tagged GLUT4 reporter were starved, treated with or without 160 nM insulin for 15 min., then chilled to 4°C and stained to detect externalized myc epitope. Images were acquired by confocal microscopy of GFP (total GLUT4) and myc epitope (surface GLUT4). GLUT4 present at the plasma membrane is highlighted by arrows; n indicates the position of the nuclei. Scale bar, 10μm. Similar results were obtained in two independent experiments.
Figure 8
Figure 8
Effects of TUG overexpression or UBX-Cter expression on distribution of perinuclear GLUT4. Unstimulated 3T3-L1 adipocytes containing GFP-tagged GLUT4 were starved, fixed and permeablized, and stained by indirect immunofluorescence to detect transferrin receptor (TfnR), an endosomal marker. Control cells, cells overexpressing intact TUG, and cells expressing TUG UBX-Cter were used as indicated. At left, the distribution of GLUT4-GFP in representative cells is shown, and arrowheads indicate GLUT4 at the plasma membrane. The indicated perinuclear regions, as well as similar regions from an additional example from each group of cells, are shown at right. Images of GLUT4 (green), TfnR (red), and merged images are presented. The overlap of GLUT4 and TfnR appears as yellow in the merged images. Arrowheads indicate perinuclear GLUT4 that does not colocalize with TfnR.
Figure 9
Figure 9
Effects of siRNA-mediated TUG depletion on GLUT4 mRNA and protein abundance. 3T3-L1 adipocytes stably expressing the GLUT4 reporter were electroporated with siRNA duplexes targeting TUG (duplex B) or, as a control, luciferase (which is not present in the cells). Cells were serum starved beginning 24 h after transfection, then duplicate plates were lysed in sample buffer (for protein analysis by SDS-PAGE and immunoblotting) or TRIzol reagent (for mRNA analysis by quantitative, real-time PCR (QPCR)). a. Triplicate samples were immunoblotted to detect GLUT4 reporter (using anti-myc antibody), endogenous TUG, and, as a control, β-actin, as indicated. Similar results were obtained for endogenous GLUT4 in cells not expressing the reporter. b. Samples treated in parallel to those shown in part a were subjected to QPCR to measure the abundance of GLUT4 reporter mRNA, plotted relative to that in control cells. Similar results were obtained for endogenous GLUT4. c. Immunoblots of GLUT4 in part a were subjected to densitometry, and band intensity is plotted relative to control cells. d. QPCR was done to measure the abundance of TUG mRNA, and is plotted relative to control cells. e. Immunoblots of TUG in part a were analyzed by densitometry, and band intensity is plotted relative to that in control cells. Error bars show standard error, and p values were calculated using a paired, two-tailed t test. The experiment shown was repeated three times with similar results.
Figure 10
Figure 10
Effect of chloroquine on GLUT4 accumulation in 3T3-L1 cells. a. Control cells and cells containing TUG UBX-Cter were treated with chloroquine for the indicated amounts of time. Cells were lysed and equal amounts of total protein were analyzed by immunoblotting to detect GLUT4 and TUG, as indicated. The experiment was repeated twice, with consistent results. b. Control, shRNA, and shRNA+TUG 3T3-L1 adipocytes were treated with chloroquine as indicated. Cells were lysed and equal amounts of total protein were analyzed by immunoblotting to detect GLUT4 and Hsc70, as indicated. Similar results were obtained in two independent experiments.
Figure 11
Figure 11
Binding of recombinant TUG and GLUT4 proteins. a. GST alone, or fused to the large intracellular loop of GLUT1 or GLUT4 was produced in bacteria and immobilized on a glutathione support. Recombinant flag-tagged TUG was produced using the Roche RTS system, and incubated with the immobilized GST proteins. Bound proteins were eluted and analyzed by SDS-PAGE and western blotting. IVT, in vitro translation. b. GST alone or GST-GLUT4loop was incubated with 35S-labeled, untagged TUG fragments (residues 1–164 or 165–550) produced by in vitro translation. Bound proteins were eluted and analyzed by SDS-PAGE and autoradiography. The experiments shown were repeated twice, with consistent results.

Similar articles

Cited by

References

    1. Bryant NJ, Govers R, James DE. Nat Rev Mol Cell Biol. 2002;3(4):267–277. - PubMed
    1. Watson RT, Kanzaki M, Pessin JE. Endocr Rev. 2004;25(2):177–204. - PubMed
    1. Shulman GI. J Clin Invest. 2000;106(2):171–176. - PMC - PubMed
    1. Abel ED, Shepherd PR, Kahn BB. Glucose transporters and pathophysiologic states. In: Le Roith D, Taylor SI, Olefsky JM, editors. Diabetes mellitus: a fundamental and clinical text. 3. Lippincott-Raven; Philadelphia: 2003.
    1. Maianu L, Keller SR, Garvey WT. J Clin Endocrinol Metab. 2001;86(11):5450–5456. - PubMed

Publication types

MeSH terms