Understanding the failure of CD8+ T-cell vaccination against simian/human immunodeficiency virus
- PMID: 17202215
- PMCID: PMC1865966
- DOI: 10.1128/JVI.01914-06
Understanding the failure of CD8+ T-cell vaccination against simian/human immunodeficiency virus
Erratum in
- J Virol. 2007 Jul;81(13):7325
Abstract
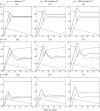
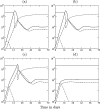
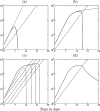
Although CD8+ T cells play an important role in controlling viral infections, boosting specific CD8+ T cells by prophylactic vaccination with simian immunodeficiency virus (SIV) epitopes fails to provide sterilizing immunity. Viral replication rates and viral contraction rates after the peak viremia hardly depend on the presence of memory CD8+ T cells. To study these paradoxical findings, we parameterize novel mathematical models for acute SIV and human immunodeficiency virus infection. These models explain that failure of vaccination is due to the fact that effector/target ratios are too low during the viral expansion phase. Because CD8+ T cells require cell-to-cell contacts, immune protection requires high effector/target ratios at the primary site of infection. Effector/target ratios become favorable for immune control at the time of the peak in the viral load when the virus becomes limited by other factors, such as the availability of uninfected target cells. At the viral set point, effector/target ratios are much higher, and perturbations of the number of CD8+ effector cells have a large impact on the viral load. Such protective effector/target ratios are difficult to achieve with nucleic acid- or protein-based vaccines.
Figures


Similar articles
-
FoxP3+ CD25+ CD8+ T-cell induction during primary simian immunodeficiency virus infection in cynomolgus macaques correlates with low CD4+ T-cell activation and high viral load.J Virol. 2007 Dec;81(24):13444-55. doi: 10.1128/JVI.01466-07. Epub 2007 Sep 26. J Virol. 2007. PMID: 17898053 Free PMC article.
-
Vaccine-induced, simian immunodeficiency virus-specific CD8+ T cells reduce virus replication but do not protect from simian immunodeficiency virus disease progression.J Immunol. 2009 Jul 1;183(1):706-17. doi: 10.4049/jimmunol.0803746. J Immunol. 2009. PMID: 19542473
-
Induction of CD8+ cells able to suppress CCR5-tropic simian immunodeficiency virus SIVmac239 replication by controlled infection of CXCR4-tropic simian-human immunodeficiency virus in vaccinated rhesus macaques.J Virol. 2007 Nov;81(21):11640-9. doi: 10.1128/JVI.01475-07. Epub 2007 Aug 29. J Virol. 2007. PMID: 17728225 Free PMC article.
-
CD8(+) T cells in preventing HIV infection and disease.AIDS. 2012 Jun 19;26(10):1281-92. doi: 10.1097/QAD.0b013e328353bcaf. AIDS. 2012. PMID: 22441256 Review.
-
The dynamics of simian immunodeficiency virus after depletion of CD8+ cells.Immunol Rev. 2018 Sep;285(1):26-37. doi: 10.1111/imr.12691. Immunol Rev. 2018. PMID: 30129200 Free PMC article. Review.
Cited by
-
Impaired immune evasion in HIV through intracellular delays and multiple infection of cells.Proc Biol Sci. 2012 Aug 7;279(1740):3003-10. doi: 10.1098/rspb.2012.0328. Epub 2012 Apr 4. Proc Biol Sci. 2012. PMID: 22492063 Free PMC article.
-
Natural killer cells promote early CD8 T cell responses against cytomegalovirus.PLoS Pathog. 2007 Aug 24;3(8):e123. doi: 10.1371/journal.ppat.0030123. PLoS Pathog. 2007. PMID: 17722980 Free PMC article.
-
Semi-infectious particles contribute substantially to influenza virus within-host dynamics when infection is dominated by spatial structure.Virus Evol. 2023 Mar 21;9(1):vead020. doi: 10.1093/ve/vead020. eCollection 2023. Virus Evol. 2023. PMID: 37538918 Free PMC article.
-
Dynamics of immune escape during HIV/SIV infection.PLoS Comput Biol. 2008 Jul 18;4(7):e1000103. doi: 10.1371/journal.pcbi.1000103. PLoS Comput Biol. 2008. PMID: 18636096 Free PMC article.
-
Killing of targets by CD8 T cells in the mouse spleen follows the law of mass action.PLoS One. 2011 Jan 24;6(1):e15959. doi: 10.1371/journal.pone.0015959. PLoS One. 2011. PMID: 21283669 Free PMC article.
References
-
- Abdel-Motal, U. M., J. Gillis, K. Manson, M. Wyand, D. Montefiori, K. Stefano-Cole, R. C. Montelaro, J. D. Altman, and R. P. Johnson. 2005. Kinetics of expansion of SIV Gag-specific CD8+ T lymphocytes following challenge of vaccinated macaques. Virology 333:226-238. - PubMed
-
- Allen, T. M., L. Mortara, B. R. Mothé, M. Liebl, P. Jing, B. Calore, M. Piekarczyk, R. Ruddersdorf, D. H. O'Connor, X. Wang, C. Wang, D. B. Allison, J. D. Altman, A. Sette, R. C. Desrosiers, G. Sutter, and D. I. Watkins. 2002. Tat-vaccinated macaques do not control simian immunodeficiency virus SIVmac239 replication. J. Virol. 76:4108-4112. - PMC - PubMed
-
- Reference deleted.
-
- Amara, R. R., K. Patel, G. Niedziela, P. Nigam, S. Sharma, S. I. Staprans, D. C. Montefiori, L. Chenareddi, J. G. Herndon, H. L. Robinson, H. M. McClure, and F. J. Novembre. 2005. A combination DNA and attenuated simian immunodeficiency virus vaccine strategy provides enhanced protection from simian/human immunodeficiency virus-induced disease. J. Virol. 79:15356-15367. - PMC - PubMed
-
- Amara, R. R., F. Villinger, J. D. Altman, S. L. Lydy, S. P. O'Neil, S. I. Staprans, D. C. Montefiori, Y. Xu, J. G. Herndon, L. S. Wyatt, M. A. Candido, N. L. Kozyr, P. L. Earl, J. M. Smith, H. L. Ma, B. D. Grimm, M. L. Hulsey, J. Miller, H. M. McClure, J. M. McNicholl, B. Moss, and H. L. Robinson. 2001. Control of a mucosal challenge and prevention of AIDS by a multiprotein DNA/MVA vaccine. Science 292:69-74. - PubMed
Publication types
MeSH terms
LinkOut - more resources
Full Text Sources
Medical
Research Materials

