

The level of viral antigen presented by hepatocytes influences CD8 T-cell function
- PMID: 17202217
- PMCID: PMC1866017
- DOI: 10.1128/JVI.02415-06
The level of viral antigen presented by hepatocytes influences CD8 T-cell function
Abstract
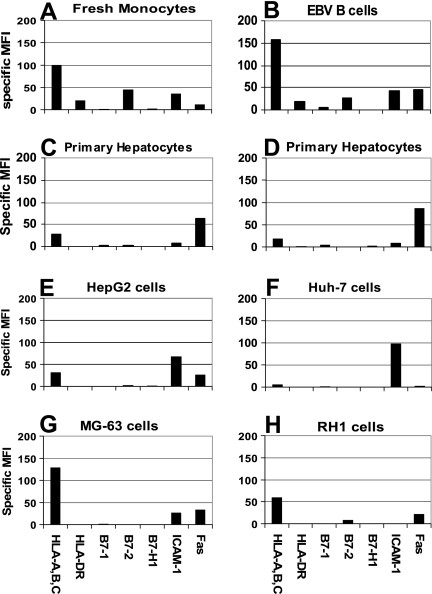
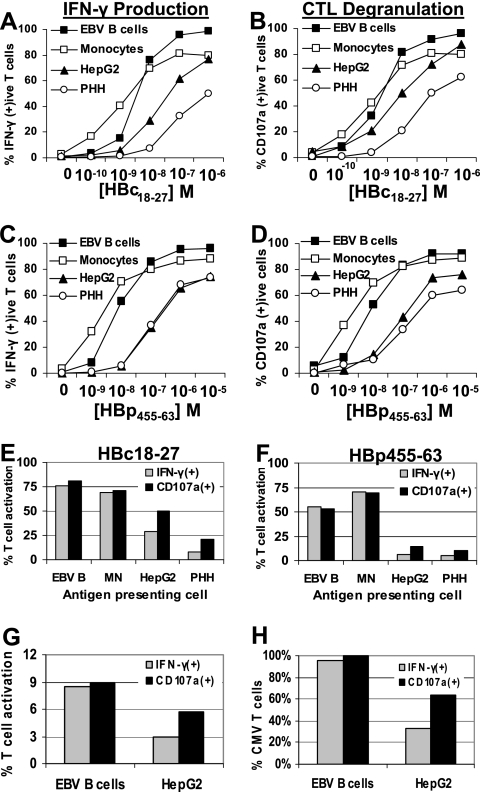
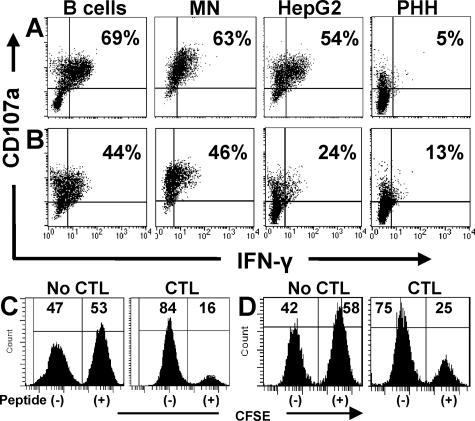
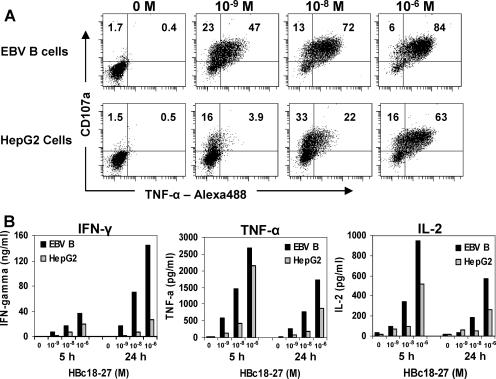
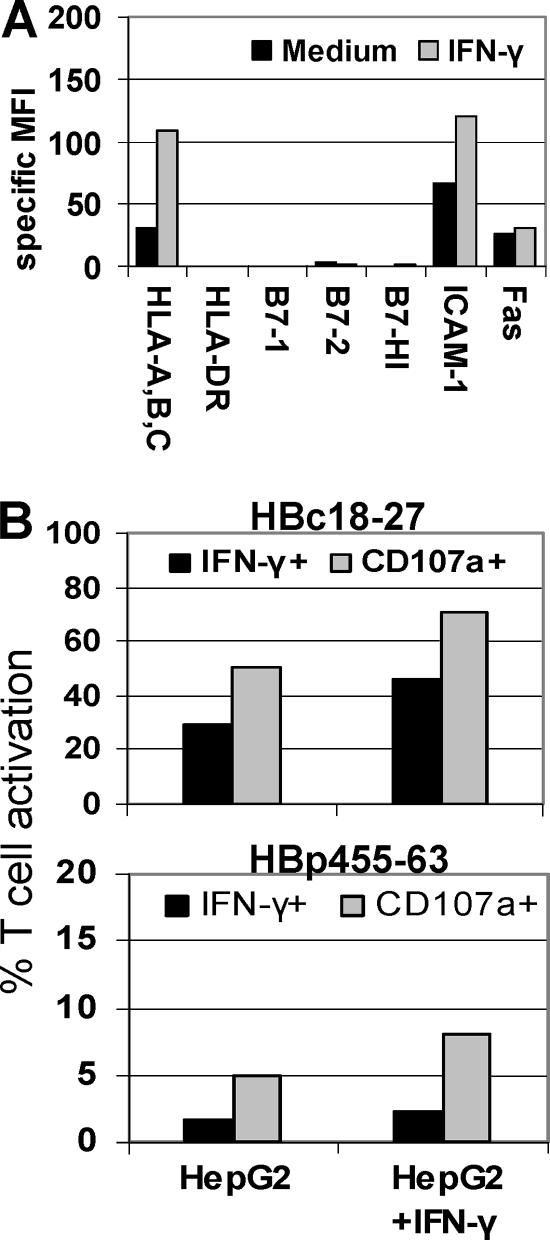
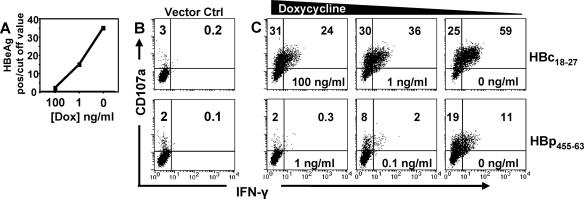
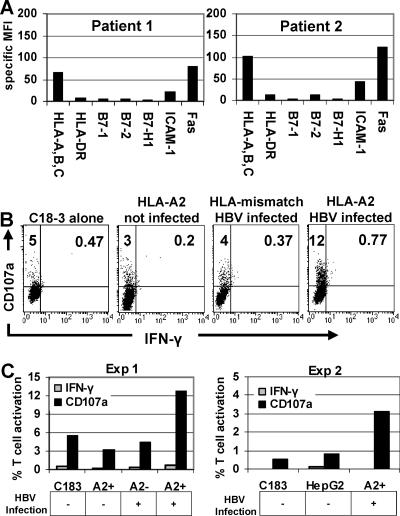
CD8 T cells exert their antiviral function through cytokines and lysis of infected cells. Because hepatocytes are susceptible to noncytolytic mechanisms of viral clearance, CD8 T-cell antiviral efficiency against hepatotropic viruses has been linked to their capacity to produce gamma interferon (IFN-gamma) and tumor necrosis factor alpha (TNF-alpha). On the other hand, intrahepatic cytokine production triggers the recruitment of mononuclear cells, which sustain acute and chronic liver damage. Using virus-specific CD8 T cells and human hepatocytes, we analyzed the modulation of virus-specific CD8 T-cell function after recognition peptide-pulsed or virally infected hepatocytes. We observed that hepatocyte antigen presentation was generally inefficient, and the quantity of viral antigen strongly influenced CD8 T-cell antiviral function. High levels of hepatitis B virus production induced robust IFN-gamma and TNF-alpha production in virus-specific CD8 T cells, while limiting amounts of viral antigen, both in hepatocyte-like cells and naturally infected human hepatocytes, preferentially stimulated CD8 T-cell degranulation. Our data document a mechanism where virus-specific CD8 T-cell function is influenced by the quantity of virus produced within hepatocytes.
Figures
Similar articles
-
CD8(+) T cell control of hepatitis B virus replication: direct comparison between cytolytic and noncytolytic functions.J Immunol. 2010 Jan 1;184(1):287-95. doi: 10.4049/jimmunol.0902761. Epub 2009 Nov 30. J Immunol. 2010. PMID: 19949099
-
Modulation of Hepatitis C Virus-Specific CD8 Effector T-Cell Function with Antiviral Effect in Infectious Hepatitis C Virus Coculture Model.J Virol. 2017 Apr 28;91(10):e02129-16. doi: 10.1128/JVI.02129-16. Print 2017 May 15. J Virol. 2017. PMID: 28275182 Free PMC article.
-
Spatiotemporal Differences in Presentation of CD8 T Cell Epitopes during Hepatitis B Virus Infection.J Virol. 2019 Feb 5;93(4):e01457-18. doi: 10.1128/JVI.01457-18. Print 2019 Feb 15. J Virol. 2019. PMID: 30518652 Free PMC article.
-
CD8+ T cell tolerance following antigen recognition on hepatocytes.J Autoimmun. 2010 Feb;34(1):15-22. doi: 10.1016/j.jaut.2009.08.005. Epub 2009 Sep 9. J Autoimmun. 2010. PMID: 19744829 Review.
-
Tissue Determinants of Antiviral Immunity in the Liver.Z Gastroenterol. 2025 Jan;63(1):65-72. doi: 10.1055/a-2365-3900. Epub 2025 Jan 10. Z Gastroenterol. 2025. PMID: 39793603 Free PMC article. Review.
Cited by
-
RNA Interference Therapy for Chronic Hepatitis B Predicts the Importance of Addressing Viral Integration When Developing Novel Cure Strategies.Viruses. 2021 Mar 30;13(4):581. doi: 10.3390/v13040581. Viruses. 2021. PMID: 33808298 Free PMC article. Review.
-
Review.Gastroenterol Hepatol (N Y). 2008 Aug;4(8):584-6. Gastroenterol Hepatol (N Y). 2008. PMID: 21960941 Free PMC article. No abstract available.
-
Heterogeneity of HBV-Specific CD8+ T-Cell Failure: Implications for Immunotherapy.Front Immunol. 2019 Sep 20;10:2240. doi: 10.3389/fimmu.2019.02240. eCollection 2019. Front Immunol. 2019. PMID: 31620140 Free PMC article. Review.
-
Binding of TCR multimers and a TCR-like antibody with distinct fine-specificities is dependent on the surface density of HLA complexes.PLoS One. 2012;7(12):e51397. doi: 10.1371/journal.pone.0051397. Epub 2012 Dec 10. PLoS One. 2012. PMID: 23251518 Free PMC article.
-
Hepatitis Delta Virus Acts as an Immunogenic Adjuvant in Hepatitis B Virus-Infected Hepatocytes.Cell Rep Med. 2020 Jul 21;1(4):100060. doi: 10.1016/j.xcrm.2020.100060. eCollection 2020 Jul 21. Cell Rep Med. 2020. PMID: 33205065 Free PMC article.
References
-
- Agnello, V., G. Abel, G. B. Knight, and E. Muchmore. 1998. Detection of widespread hepatocyte infection in chronic hepatitis C. Hepatology 28:573-584. - PubMed
-
- Ando, K., L. G. Guidotti, S. Wirth, T. Ishikawa, G. Missale, T. Moriyama, R. D. Schreiber, H. J. Schlicht, S. N. Huang, and F. V. Chisari. 1994. Class I-restricted cytotoxic T lymphocytes are directly cytopathic for their target cells in vivo. J. Immunol. 152:3245-3253. - PubMed
-
- Barrie, M. B., H. W. Stout, M. S. Abougergi, B. C. Miller, and D. L. Thiele. 2004. Antiviral cytokines induce hepatic expression of the granzyme B inhibitors, proteinase inhibitor 9 and serine proteinase inhibitor 6. J. Immunol. 172:6453-6459. - PubMed
-
- Bertoletti, A., and C. Ferrari. 2003. Kinetics of the immune response during HBV and HCV infection. Hepatology 38:4-13. - PubMed
Publication types
MeSH terms
Substances
Grants and funding
LinkOut - more resources
Full Text Sources
Other Literature Sources
Research Materials
