

The ci/bH moiety in the b6f complex studied by EPR: a pair of strongly interacting hemes
- PMID: 17202266
- PMCID: PMC1766417
- DOI: 10.1073/pnas.0606369104
The ci/bH moiety in the b6f complex studied by EPR: a pair of strongly interacting hemes
Abstract
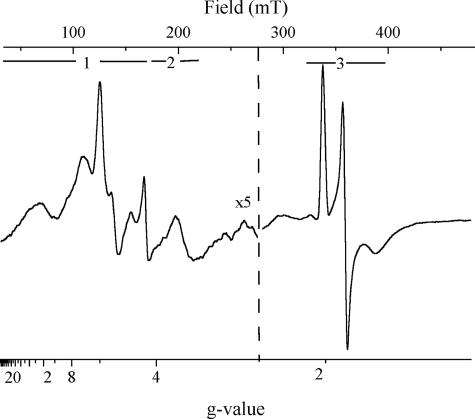
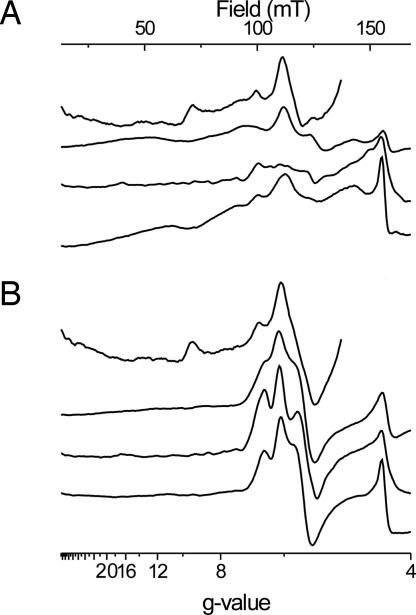
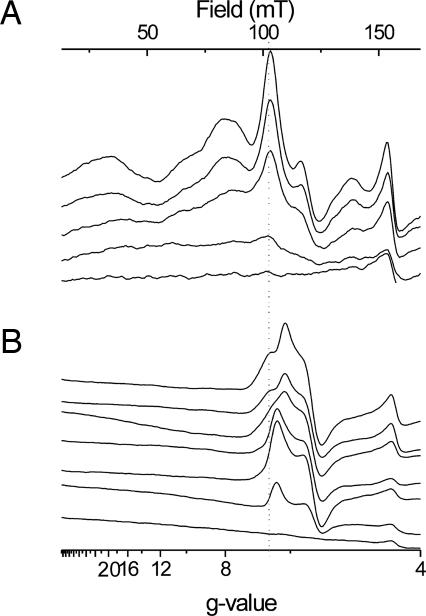
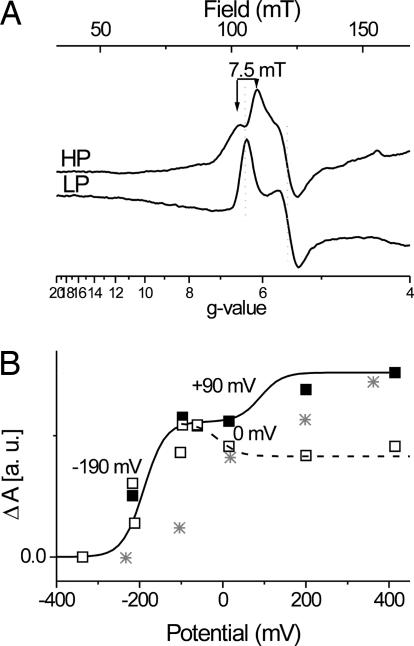
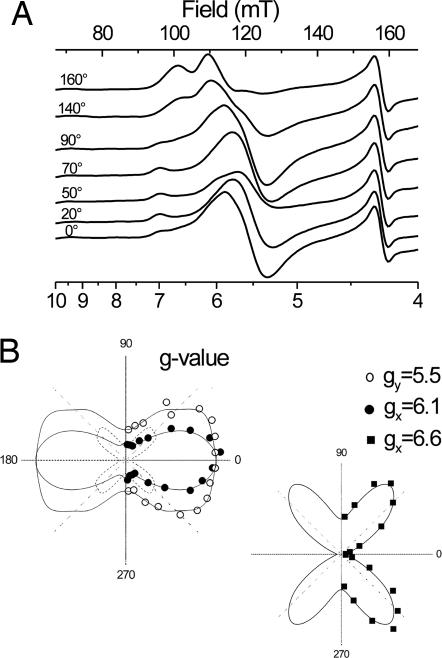
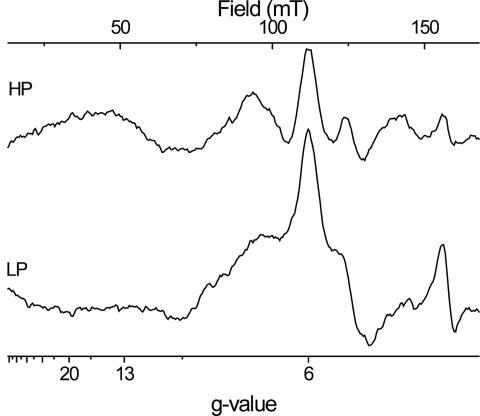
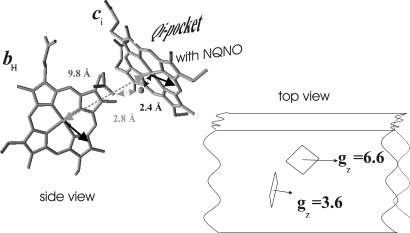
X-band EPR features in the region of 90-150 mT have previously been attributed to heme ci of the b6 complex [Zhang H, Primak A, Bowman MK, Kramer DM, Cramer WA (2004) Biochemistry 43:16329-16336] and interpreted as arising from a high-spin species. However, the complexity of the observed spectrum is rather untypical for high-spin hemes. In this work, we show that addition of the inhibitor 2-n-nonyl-4-hydroxyquinoline N-oxide largely simplifies heme ci's EPR properties. The spectrum in the presence of 2-n-nonyl-4-hydroxyquinoline N-oxide is demonstrated to be caused by a simple S = 5/2, rhombic species split by magnetic dipolar interaction (A(xx )= 7.5 mT) with neighboring heme bH. The large spacing of lines in the uninhibited system, by contrast, cannot be rationalized solely on the basis of magnetic dipolar coupling but is likely to encompass strong contributions from exchange interactions. The role of the H2O/OH- molecule bridging heme ci's Fe atom and heme bH's propionate side chain in mediating these interactions is discussed.
Conflict of interest statement
The authors declare no conflict of interest.
Figures
Similar articles
-
Spectral and redox characterization of the heme ci of the cytochrome b6f complex.Proc Natl Acad Sci U S A. 2005 Nov 1;102(44):15860-5. doi: 10.1073/pnas.0508102102. Epub 2005 Oct 24. Proc Natl Acad Sci U S A. 2005. PMID: 16247018 Free PMC article.
-
Characterization of the high-spin heme x in the cytochrome b6f complex of oxygenic photosynthesis.Biochemistry. 2004 Dec 28;43(51):16329-36. doi: 10.1021/bi048363p. Biochemistry. 2004. PMID: 15610027
-
Heme-heme interactions in the cytochrome b6f complex: EPR spectroscopy and correlation with structure.J Am Chem Soc. 2006 Nov 8;128(44):14246-7. doi: 10.1021/ja065798m. J Am Chem Soc. 2006. PMID: 17076484 Free PMC article.
-
Consequences of the structure of the cytochrome b6f complex for its charge transfer pathways.Biochim Biophys Acta. 2006 May-Jun;1757(5-6):339-45. doi: 10.1016/j.bbabio.2006.04.020. Epub 2006 May 4. Biochim Biophys Acta. 2006. PMID: 16787635 Review.
-
Structure-function of the cytochrome b6f complex.Photochem Photobiol. 2008 Nov-Dec;84(6):1349-58. doi: 10.1111/j.1751-1097.2008.00444.x. Photochem Photobiol. 2008. PMID: 19067956 Review.
Cited by
-
Unexpected Heme Redox Potential Values Implicate an Uphill Step in Cytochrome b6f.J Phys Chem B. 2022 Dec 1;126(47):9771-9780. doi: 10.1021/acs.jpcb.2c05729. Epub 2022 Nov 18. J Phys Chem B. 2022. PMID: 36399615 Free PMC article.
-
Indoleamine 2,3-dioxygenase is the anticancer target for a novel series of potent naphthoquinone-based inhibitors.J Med Chem. 2008 Mar 27;51(6):1706-18. doi: 10.1021/jm7014155. Epub 2008 Mar 5. J Med Chem. 2008. PMID: 18318466 Free PMC article.
-
EPR detection of an O(2) surrogate bound to heme c(n) of the cytochrome b(6)f complex.J Am Chem Soc. 2009 Sep 9;131(35):12536-7. doi: 10.1021/ja905171c. J Am Chem Soc. 2009. PMID: 19689132 Free PMC article.
-
Natively oxidized amino acid residues in the spinach cytochrome b 6 f complex.Photosynth Res. 2018 Jul;137(1):141-151. doi: 10.1007/s11120-018-0485-0. Epub 2018 Jan 29. Photosynth Res. 2018. PMID: 29380263
-
Metastable radical state, nonreactive with oxygen, is inherent to catalysis by respiratory and photosynthetic cytochromes bc1/b6f.Proc Natl Acad Sci U S A. 2017 Feb 7;114(6):1323-1328. doi: 10.1073/pnas.1618840114. Epub 2017 Jan 23. Proc Natl Acad Sci U S A. 2017. PMID: 28115711 Free PMC article.
References
Publication types
MeSH terms
Substances
LinkOut - more resources
Full Text Sources
