

B cells and T cells are critical for the preservation of bone homeostasis and attainment of peak bone mass in vivo
- PMID: 17202317
- PMCID: PMC1874582
- DOI: 10.1182/blood-2006-07-037994
B cells and T cells are critical for the preservation of bone homeostasis and attainment of peak bone mass in vivo
Abstract
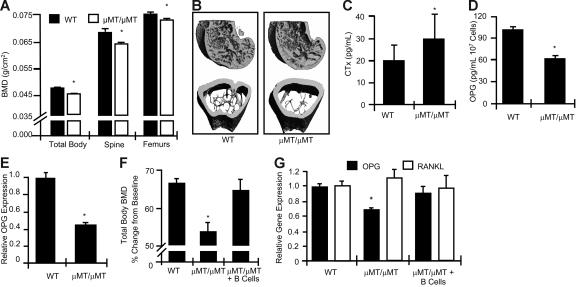
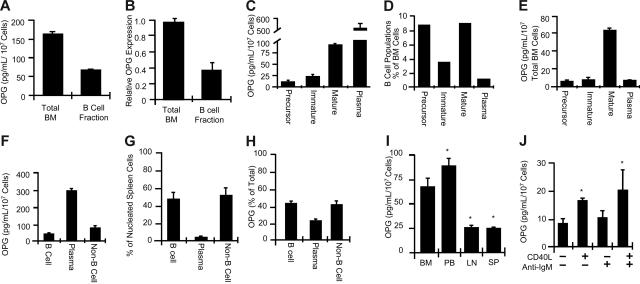
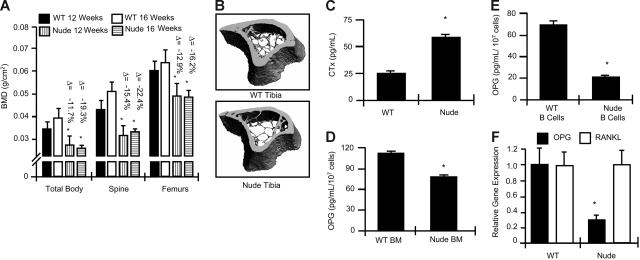
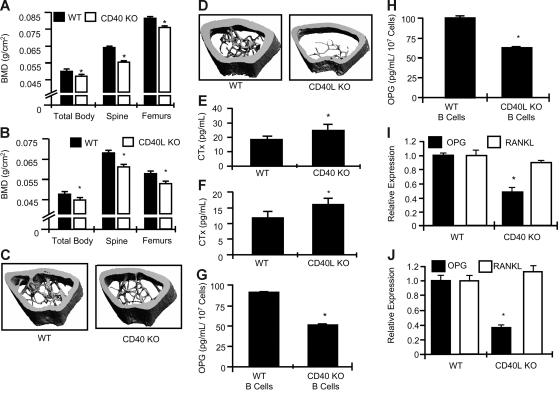
Bone homeostasis is regulated by a delicate balance between osteoblastic bone formation and osteoclastic bone resorption. Osteoclastogenesis is controlled by the ratio of receptor activator of NF-kappaB ligand (RANKL) relative to its decoy receptor, osteoprotegerin (OPG). The source of OPG has historically been attributed to osteoblasts (OBs). While activated lymphocytes play established roles in pathological bone destruction, no role for lymphocytes in basal bone homeostasis in vivo has been described. Using immunomagnetic isolation of bone marrow (BM) B cells and B-cell precursor populations and quantitation of their OPG production by enzyme-linked immunosorbent assay (ELISA) and real-time reverse transcriptase-polymerase chain reaction (RT-PCR), cells of the B lineage were found to be responsible for 64% of total BM OPG production, with 45% derived from mature B cells. Consistently B-cell knockout (KO) mice were found to be osteoporotic and deficient in BM OPG, phenomena rescued by B-cell reconstitution. Furthermore, T cells, through CD40 ligand (CD40L) to CD40 costimulation, promote OPG production by B cells in vivo. Consequently, T-cell-deficient nude mice, CD40 KO mice, and CD40L KO mice display osteoporosis and diminished BM OPG production. Our data suggest that lymphocytes are essential stabilizers of basal bone turnover and critical regulators of peak bone mass in vivo.
Figures
Similar articles
-
Toll-Like Receptor 2 Stimulation of Osteoblasts Mediates Staphylococcus Aureus Induced Bone Resorption and Osteoclastogenesis through Enhanced RANKL.PLoS One. 2016 Jun 16;11(6):e0156708. doi: 10.1371/journal.pone.0156708. eCollection 2016. PLoS One. 2016. PMID: 27311019 Free PMC article.
-
Aging increases stromal/osteoblastic cell-induced osteoclastogenesis and alters the osteoclast precursor pool in the mouse.J Bone Miner Res. 2005 Sep;20(9):1659-68. doi: 10.1359/JBMR.050503. Epub 2005 May 2. J Bone Miner Res. 2005. PMID: 16059637
-
[The OPG/RANKL/RANK system and bone resorptive disease].Sheng Wu Gong Cheng Xue Bao. 2003 Nov;19(6):655-60. Sheng Wu Gong Cheng Xue Bao. 2003. PMID: 15971575 Review. Chinese.
-
Heparin enhances osteoclastic bone resorption by inhibiting osteoprotegerin activity.Bone. 2007 Aug;41(2):165-74. doi: 10.1016/j.bone.2007.04.190. Epub 2007 May 5. Bone. 2007. PMID: 17560185
-
Role of receptor activator of nuclear factor-kappaB ligand and osteoprotegerin in bone cell biology.J Mol Med (Berl). 2001 Jun;79(5-6):243-53. doi: 10.1007/s001090100226. J Mol Med (Berl). 2001. PMID: 11485016 Review.
Cited by
-
The role of toll-like receptors in orchestrating osteogenic differentiation of mesenchymal stromal cells and osteoimmunology.Front Cell Dev Biol. 2023 Oct 23;11:1277686. doi: 10.3389/fcell.2023.1277686. eCollection 2023. Front Cell Dev Biol. 2023. PMID: 37941898 Free PMC article. Review.
-
New perspectives on traumatic bone infections.Chin J Traumatol. 2020 Dec;23(6):314-318. doi: 10.1016/j.cjtee.2020.05.009. Epub 2020 Jun 2. Chin J Traumatol. 2020. PMID: 32847694 Free PMC article. Review.
-
[B cells. Interactions and antibody production].Z Rheumatol. 2013 May;72(4):372-4. doi: 10.1007/s00393-012-1128-z. Z Rheumatol. 2013. PMID: 23588922 German. No abstract available.
-
Prevention and Treatment of Osteoporosis Using Chinese Medicinal Plants: Special Emphasis on Mechanisms of Immune Modulation.J Immunol Res. 2018 Feb 20;2018:6345857. doi: 10.1155/2018/6345857. eCollection 2018. J Immunol Res. 2018. PMID: 29675436 Free PMC article. Review.
-
Cytokine-mediated bone destruction in rheumatoid arthritis.J Immunol Res. 2014;2014:263625. doi: 10.1155/2014/263625. Epub 2014 Sep 10. J Immunol Res. 2014. PMID: 25295284 Free PMC article. Review.
References
-
- Khosla S. Minireview: the OPG/RANKL/RANK system. Endocrinology. 2001;142:5050–5055. - PubMed
-
- Teitelbaum SL. Bone resorption by osteoclasts. Science. 2000;289:1504–1508. - PubMed
-
- Simonet WS, Lacey DL, Dunstan CR, et al. Osteoprotegerin: a novel secreted protein involved in the regulation of bone density. Cell. 1997;89:309–319. - PubMed
-
- Mizuno A, Amizuka N, Irie K, et al. Severe osteoporosis in mice lacking osteoclastogenesis inhibitory factor/osteoprotegerin. Biochem Biophys Res Commun. 1998;247:610–615. - PubMed
Publication types
MeSH terms
Substances
Grants and funding
LinkOut - more resources
Full Text Sources
Other Literature Sources
Molecular Biology Databases
Research Materials
