. 2007 Jan 3;27(1):98-110.
doi: 10.1523/JNEUROSCI.2683-06.2007.

Vocal premotor activity in the superior colliculus

Affiliations

Vocal premotor activity in the superior colliculus

Shiva R Sinha et al. J Neurosci. .

Abstract

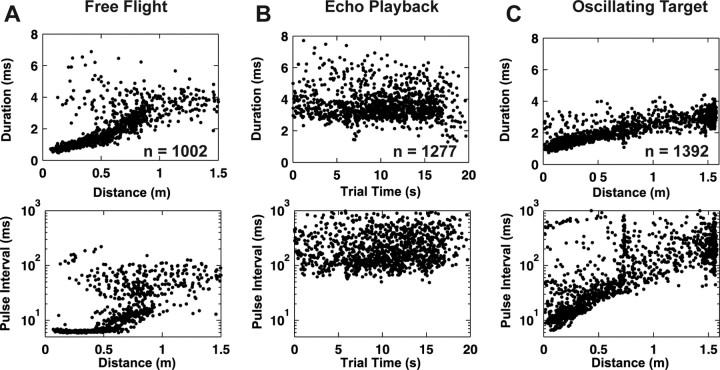
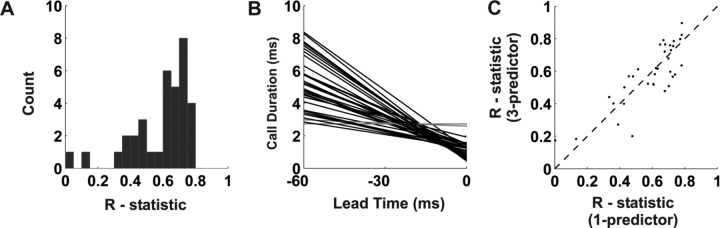
Chronic neural recordings were taken from the midbrain superior colliculus (SC) of echolocating bats while they were engaged in one of two distinct behavioral tasks: virtual target amplitude discrimination (VTAD) and real oscillating target tracking (ROTT). In the VTAD task, bats used a limited range of sonar call features to discriminate the amplitude category of echoes, whereas in the ROTT task, the bat produced dynamically modulated sonar calls to track a moving target. Newly developed methods for chronic recordings in unrestrained, behaving bats reveal two consistent bouts of SC neural activity preceding the onset of sonar vocalizations in both tasks. A short lead bout occurs tightly coupled to vocal onset (VTAD, -5.1 to -2.2 ms range, -3.6 +/- 0.7 ms mean lead time; ROTT, -3.0 to + 0.4 ms range, -1.2 +/- 1.3 ms mean lead time), and this activity may play a role in marking the time of each sonar emission. A long lead bout in SC activity occurs earlier and spreads over a longer interval (VTAD, -40.6 to -8.4 ms range, -22.2 +/- 3.9 ms mean lead time; ROTT, -29.8 to -7.1 ms range, -17.5 +/- 9.1 ms mean lead time) when compared with short lead events. In the goal-directed ROTT task, the timing of long lead event times vary with the bat's sonar call duration. This finding, along with behavioral studies demonstrating that bats adjust sonar call duration as they track targets at changing distance, suggests the bat SC contributes to range-dependent adjustments of sonar call duration.


Figures

Figure 1.
Figure 1.
Sonar vocal behavior, audiovocal neuronal circuitry, dorsal SC position, and experimental subject. A, Time waveform and selected spectrograms of a sequence of sonar vocalizations produced by a flying bat attacking a stationary insect target. Typical of an insect pursuit sequence, there are dynamic changes in the sonar pulse intervals as bats approach and capture a target (top). The representative spectrograms demonstrate the change in bandwidth, call duration, and sweep rate during insect capture (bottom). Asterisks are positioned below calls for which spectrograms are shown. B, Network of input–output pathways that connect the SC with the sonar vocal production circuitry. Lemniscal (black arrow, top) and paralemniscal (gray arrow, at side) auditory inputs are integrated in the SC, which in turn projects to the laryngeal motor neurons indirectly via a tecto-tegemento-bulbar pathway. C, Top view drawing of the bat brain showing the dorsomedial position and relative size of the superior colliculus compared with adjacent structures. CBR, Cerebrum; CBL, cerebellum. Scale bar, 5 mm. D, Photograph of a 15 g bat with chronic implant before recording session. The small interface board mates with a removable amplifier head-stage board.
Figure 2.
Figure 2.
Experimental design for the flight room experiments and the two different behavioral paradigms used for chronic recordings. A, Top view of the flight room, showing position of high-speed cameras (240 frames/s). Bats are permitted to fly within the entire room, but the edible target is only hung within the target area. B, During virtual target amplitude discrimination trial sonar calls produced by a bat are acquired, modified to simulate sonar echoes, and played back to the bat. Playback echoes are either from a loud intensity group (I) or a soft intensity group (II). The delays of the playback echoes are randomly chosen during the trial from a limited range of values (7–12 ms). C, Schematic of the virtual target amplitude discrimination setup. Bats rest on a behavioral platform and produce sonar vocalizations directed toward an ultrasonic microphone. The signals are modified by a computer and played back to the bat via a speaker positioned above and behind the microphone. D, Schematic of the real oscillating target tracking setup. Bats are trained to rest on a platform and use echolocation to track and capture a moving target. The target, positioned on a horizontal arm connected to a single pivot point vertical pendulum, swings in a single plane intersecting the bat's position.
Figure 3.
Figure 3.
The temporal characteristics of sonar vocal sequences in different behavioral tasks. The sonar call duration (top row) and pulse interval (bottom row) are shown as a function of target distance or trial time. A, Data from two free-flying bats attacking a stationary edible target. Sonar call duration and pulse interval show distinctive changes as a function of target distance. B, During a virtual target amplitude discrimination experiment, call duration and pulse interval are large compared with the other tasks and vary in a nonpatterned manner over the course of each trial. C, In real oscillating target tracking trials, bats remain stationary and a target oscillates toward and away from the bat. Sonar call duration and pulse interval vary closely with target distance. Data in A–C comprise sonar calls, from all trials, during one session. The total number of call parameters plotted for each behavioral task is shown in the top row.
Figure 4.
Figure 4.
Variation in sonar call durations with target distance and pulse interval in a real oscillating target tracking trial. A, The close coupling between sonar call duration and target distance is highlighted in an oscillating target trial. Target distance (gray diamonds) and call durations (black circles) are shown as a function of trial time (0–12 s). B, Sonar call duration versus pulse interval for all 1392 calls in Figure 3C. Pulse interval varies over a wide range during both real oscillating target tracking and free-flight trial conditions. The exponential relationship between call duration and PI is made clear in this semi-log plot.
Figure 5.
Figure 5.
Premotor neural activity in the SC associated with sonar call production. A, Time waveform and spectrogram of a single 3.8-ms-duration sonar vocalization produced during virtual target amplitude discrimination experiment. B, Neural activity recorded simultaneously with sonar vocalizations in the SC. Bouts of neural activity in the superior colliculus consistently precede the onset of sonar vocalizations. Red ticks above neural activity in B and C are identically placed and correspond with the onset time of sonar vocalizations. C, Rectified waveform of the neural activity in B, low-pass filtered (<100 Hz) with an eighth-order Butterworth filter.
Figure 6.
Figure 6.
Sonar-related premotor activity is consistently observed in all recordings from SC. A, Raster of events (top) preceding the onset of sonar vocalizations during one trial (bat VTAD1). Ordinate represents consecutive sonar calls from first to last in the trial. Call onset is at t = 0 ms, and the raster extends from 60 ms before to 10 ms after sonar vocal onset. During this trial, 74 sonar calls were produced, and both long and short lead events were evident. A PMTH (bottom) representation of neural events. The dashed line shows the baseline activity level, and the solid line represents the criterion threshold (2 SD above mean baseline rate) used for determining change from baseline activity. A clear reduction in firing rate is observed between the long lead and short lead events and after call onset. B, The PI and sonar call duration of vocalizations produced during the trial shown in A. PI is generally long, >75 ms, in virtual target amplitude discrimination trials. C, Linear regression using the per call mean LLE time (〈LLE〉TIME) as the single predictor for sonar call duration. The sonar calls (n = 1026 calls) come from one session (including the trial in A) and show only a marginal increase in 〈LLE〉TIME with increasing call duration. D, Linear regression using the 〈LLE〉spread (see Materials and Methods) for each call in one session as the single predictor of call duration. 〈LLE〉spread shows a slight positive increase with call duration.
Figure 7.
Figure 7.
Premotor neuronal activity recorded in the SC during a single oscillating target trial. A, Raster and perimotor time histogram show a pattern of premotor activity similar to that observed in virtual target amplitude discrimination recordings. LLEs and SLEs precede sonar vocalizations with a reduction toward baseline activity rates between the two event groups. Data are aligned to sonar call onset (lead time of t = 0 ms). LLEs in the raster show a tendency toward shorter lead times during the trial and correspond to times when the target is approaching the bat. B, PI (gray, filled), start (black, filled), and end (black, open) frequency, call duration (black, open), and target distance (black, filled) of sonar vocalizations produced during trial shown in A. The oscillating target approaches and recedes from the bat twice in this trial. Each sonar call parameter is modulated as a function of the target distance. Sonar call duration and pulse interval are clearly decreased whenever the target approaches. C, Linear regression using the per call mean LLE time (〈LLE〉TIME) as the single predictor of sonar call duration for all sonar calls in one recording session (n = 738 calls). The data show an increase in 〈LLE〉TIME for increasing sonar call durations (r = 0.73). D, Reduction in the correlation between sonar call duration and 〈LLE〉TIME when 〈LLE〉TIME is not associated with the call it precedes. Each panel shows the sonar call duration versus the 〈LLE〉TIME using the data from C. Except for the top left, the other panels show the data with 〈LLE〉TIME associated with the sonar call duration one, three, and five calls ahead in the vocal sequence. r values are regression coefficients.
Figure 8.
Figure 8.
Linear regression analyses using per call mean LLE time (〈LLE〉TIME) to predict call duration. Linear regression analyses were performed for all sites (n = 35) for which sonar call duration and mean LLE time were well approximated by linear relationship. A, Histogram of the r statistic calculated from the linear regression analyses. At each recording site, the 〈LLE〉TIME was the single predictor to estimate sonar call duration. At 23 of 35 sites, regression coefficients are >0.60. B, Linear regression line fits from the 35 sites, in the superior colliculus of three bats. The mean slope for all slopes significantly greater than zero (black lines) is −0.084 ± 0.033. C, r statistics from linear regressions using per call event rate, per call spread, and 〈LLE〉TIME as predictors of sonar call duration plotted against a single-predictor (〈LLE〉TIME) r statistic values. A modest increase in the magnitude of the regression coefficients is observed at the majority of sites, as demonstrated by points lying above the unity line.
Figure 9.
Figure 9.
Short lead events are time locked well to sonar vocal onsets. Data in A–C are from three different randomly selected sites in three different bats and comprise all of the SLE data from single sessions. The short lead event data were collected while bats used echolocation to track a real oscillating target swinging toward and away from the bat. Top panels are sonar call duration versus short lead event times showing the uniform occurrence of event times with sonar call duration. Bottom row show histograms of the number of events at each time showing the precision of short lead events. Time bins are 0.25 ms. Values shown in bottom row represent the number of sonar calls used to construct each plot. Dots at the top of the ordinate, in the bottom row, draw attention to the different range of counts.
Figure 10.
Figure 10.
Control experiments conducted to verify relationship between SC premotor neural activity and sonar vocalizations. A, Neural recordings were recorded simultaneously with non-sonar calls produced spontaneously by bats. Left, A raster plot and corresponding PMTHs do not show long lead events or short lead events when bats produce non-sonar calls. The raster and PMTHs show SC neural activity aligned with vocal onset (t = 0 ms) for n = 79 non-sonar calls from a single site. Right, Pulse interval, bandwidth, and call duration of non-sonar calls. B, Head movements were tracked during the production of sonar vocalizations. The movement trajectories were normalized, to facilitate cross trial comparisons, using a z-score function. A reduction in the amount of head rotation precedes the expected time (gray bar) of premotor activity. The amount of head motion becomes increasingly variable at less reliable points in time after call onset. Data are from three bats (4 sessions), aligned to sonar call onset (t = 0 ms). Vertical gray bar represents mean time of long lead events ± 1 SD, as recorded in separate virtual target amplitude discrimination experiments. C, No pre-vocal neural activity is observed in the inferior colliculus before sonar vocalizations. Gray dots represent the time of the last call, and black dots are event times. The PMTH shows low firing rates. Sonar pulse intervals range from 20 to 410 ms, similar to the range observed during virtual target discrimination experiments. Sonar call bandwidth, start frequencies (black, filled circles), and end frequencies (black, open circles) are shown for all of the sonar calls produced in this trial. D, Raster and PMTH of electromyogram events recorded from the muscles of mastication on the dorsal surface of the skull. Events around sonar calls (n = 100 sonar calls) are aligned to call onset (lead time of t = 0 ms) and do not show deviations in rate before or after call onset. The event rate remains low (50 ± 5 events/s) around each sonar call onset.

Similar articles

Cited by

References

    1. Bankman IN, Johnson KO, Schneider W. Optimal detection, classification, and superposition resolution in neural waveform recordings. IEEE Trans Biomed Eng. 1993;40:836–841. - PubMed
    1. Casseday JH, Kobler JB, Isbey SF, Covey E. Central acoustic tract in an echolocating bat: an extralemniscal auditory pathway to the thalamus. J Comp Neurol. 1989;287:247–259. - PubMed
    1. Chaturvedi V, Van Gisbergen JA. Perturbation of combined saccade-vergence movements by microstimulation in monkey superior colliculus. J Neurophysiol. 1999;81:2279–2296. - PubMed
    1. Chaturvedi V, Van Gisbergen JA. Stimulation in the rostral pole of monkey superior colliculus: effects on vergence eye movements. Exp Brain Res. 2000;132:72–78. - PubMed
    1. Covey E, Hall WC, Kobler JB. Subcortical connections of the superior colliculus in the mustache bat, Pteronotus parnellii. J Comp Neurol. 1987;263:179–197. - PubMed

Publication types

MeSH terms

LinkOut - more resources