High thalamocortical theta coherence in patients with Parkinson's disease
- PMID: 17202479
- PMCID: PMC6672280
- DOI: 10.1523/JNEUROSCI.2411-06.2007
High thalamocortical theta coherence in patients with Parkinson's disease
Abstract
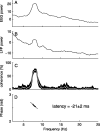
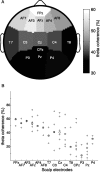
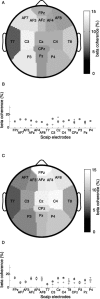
Research investigating the pathophysiology of Parkinson's disease (PD) mostly focuses on basal ganglia dysfunction. However, the main output from the basal ganglia is via the thalamus, and corticothalamic feedback constitutes the primary source of synapses in the thalamus. We therefore focus on the thalamocortical interplay. During the surgical intervention in six patients, local field potentials (LFPs) were recorded from pallidal-recipient thalamic nuclei VA and VLa. Simultaneously, EEG was recorded from several sites on the scalp. The highest thalamocortical coherence was found in the theta frequency band (4-9 Hz) with a mean peak frequency of 7.5 Hz. The magnitude of thalamocortical theta coherence was comparable to the magnitude of EEG coherence between scalp electrode pairs. Thalamocortical theta coherence reached 70% and was maximal with frontal scalp sites on both hemispheres. In the 13-20 Hz beta frequency band, maximal coherence was comparatively low but localized on the scalp ipsilateral to the site of thalamic LFP recording. The high thalamocortical coherence underlines the importance of thalamic function for the genesis of scalp EEG. We discuss the PD pathophysiology within the framework of dysrhythmic thalamocortical interplay, which has important consequences for the choice of therapeutic strategy in patients with severe forms of PD.
Figures


Similar articles
-
High thalamocortical theta coherence in patients with neurogenic pain.Neuroimage. 2008 Feb 15;39(4):1910-7. doi: 10.1016/j.neuroimage.2007.10.019. Epub 2007 Oct 25. Neuroimage. 2008. PMID: 18060808
-
Thalamocortical theta coherence in neurological patients at rest and during a working memory task.Int J Psychophysiol. 2005 Aug;57(2):87-96. doi: 10.1016/j.ijpsycho.2005.03.015. Int J Psychophysiol. 2005. PMID: 15982767
-
Hallucinations, somatic-functional disorders of PD-DLB as expressions of thalamic dysfunction.Mov Disord. 2019 Aug;34(8):1100-1111. doi: 10.1002/mds.27781. Epub 2019 Jul 15. Mov Disord. 2019. PMID: 31307115 Free PMC article. Review.
-
Different functional loops between cerebral cortex and the subthalmic area in Parkinson's disease.Cereb Cortex. 2006 Jan;16(1):64-75. doi: 10.1093/cercor/bhi084. Epub 2005 Apr 13. Cereb Cortex. 2006. PMID: 15829734 Clinical Trial.
-
Physiology and pathophysiology of the basal ganglia-thalamo-cortical networks.Parkinsonism Relat Disord. 2007;13 Suppl 3:S437-9. doi: 10.1016/S1353-8020(08)70045-2. Parkinsonism Relat Disord. 2007. PMID: 18267279 Review.
Cited by
-
Dynamics of Circadian Thalamocortical Flow of Information during a Peripheral Neuropathic Pain Condition.Front Integr Neurosci. 2011 Aug 23;5:43. doi: 10.3389/fnint.2011.00043. eCollection 2011. Front Integr Neurosci. 2011. PMID: 22007162 Free PMC article.
-
Early impairment of thalamocortical circuit activity and coherence in a mouse model of Huntington's disease.Neurobiol Dis. 2021 Sep;157:105447. doi: 10.1016/j.nbd.2021.105447. Epub 2021 Jul 16. Neurobiol Dis. 2021. PMID: 34274461 Free PMC article.
-
Spike timing amplifies the effect of electric fields on neurons: implications for endogenous field effects.J Neurosci. 2007 Mar 14;27(11):3030-6. doi: 10.1523/JNEUROSCI.0095-07.2007. J Neurosci. 2007. PMID: 17360926 Free PMC article.
-
Towards a Mechanistic-Driven Precision Medicine Approach for Tinnitus.J Assoc Res Otolaryngol. 2019 Apr;20(2):115-131. doi: 10.1007/s10162-018-00709-9. Epub 2019 Mar 1. J Assoc Res Otolaryngol. 2019. PMID: 30825037 Free PMC article. Review.
-
Presurgical thalamocortical connectivity is associated with response to vagus nerve stimulation in children with intractable epilepsy.Neuroimage Clin. 2017 Sep 22;16:634-642. doi: 10.1016/j.nicl.2017.09.015. eCollection 2017. Neuroimage Clin. 2017. PMID: 28971013 Free PMC article.
References
-
- Anderson ME, Postupna N, Ruffo M. Effects of high-frequency stimulation in the internal globus pallidus on the activity of thalamic neurons in the awake monkey. J Neurophysiol. 2003;89:1150–1160. - PubMed
-
- Bullock TH, McClune MC, Achimowicz JZ, Iragui-Madoz VJ, Duckrow RB, Spencer SS. EEG coherence has structure in the millimeter domain: subdural and hippocampal recordings from epileptic patients. Electroencephalogr Clin Neurophysiol. 1995;95:161–177. - PubMed
-
- Contreras D, Destexhe A, Sejnowski TJ, Steriade M. Control of spatiotemporal coherence of a thalamic oscillation by corticothalamic feedback. Science. 1996;274:771–774. - PubMed
-
- Delorme A, Makeig S. EEGLAB: an open source toolbox for analysis of single-trial EEG dynamics including independent component analysis. J Neurosci Methods. 2004;134:9–21. - PubMed
-
- Destexhe A. Modelling corticothalamic feedback and the gating of the thalamus by the cerebral cortex. J Physiol (Paris) 2000;94:391–410. - PubMed
Publication types
MeSH terms
LinkOut - more resources
Full Text Sources
Medical
