. 2007 Jan 3;27(1):141-51.
doi: 10.1523/JNEUROSCI.3739-06.2007.

Depolarization and neurotransmitter regulation of vasopressin gene expression in the rat suprachiasmatic nucleus in vitro

Affiliations

Depolarization and neurotransmitter regulation of vasopressin gene expression in the rat suprachiasmatic nucleus in vitro

Milan Rusnak et al. J Neurosci. .

Abstract

Vasopressin (VP) transcription in the rat suprachiasmatic nucleus (SCN) in organotypic culture was studied by in situ hybridization histochemistry using an intron-specific VP heteronuclear RNA probe. The circadian peak of VP gene transcription in the SCN in vitro is completely blocked by a 2 h exposure to tetrodotoxin (TTX) in the culture medium, and this TTX inhibition of VP gene transcription is reversed by exposure of the SCN to either forskolin or potassium depolarization. This suggests that an intrinsic, spontaneously active neuronal mechanism in the SCN is responsible for the cAMP- and depolarization-dependent pathways involved in maintaining peak VP gene transcription. In this paper, we evaluate a variety of neurotransmitter candidates, membrane receptors, and signal-transduction cascades that might constitute the mechanisms responsible for the peak of VP gene transcription. We find that vasoactive intestinal peptide (VIP) and a VPAC2 (VIP receptor subtype 2) receptor-specific agonist, Ro-25-1553, are the most effective ligands tested in evoking a cAMP-mitogen-activated protein kinase signal transduction cascade leading to an increase in VP gene transcription in the SCN. In addition, a second independent pathway involving depolarization activating L-type voltage-gated calcium channels and a Ca-dependent kinase pathway [inhibited by KN62 (1-[N,O-bis(5-isoquinolinesulphonyl)-N-methyl-L-tyrosyl]-4-phenylpiperazine)] rescues VP gene transcription in the presence of TTX. In the absence of TTX, these independent pathways appear to act in a cooperative manner to generate the circadian peak of VP gene transcription in the SCN.


Figures

Figure 1.
Figure 1.
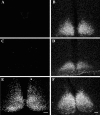
Patterns of glutamate agonist-stimulated c-Fos expression in the SCN in vitro in the absence (A, B) and presence (C–F) of 2.5 μm TTX. Representative c-Fos-IR patterns are shown for unstimulated (control) slices (A), slices stimulated by 50 μm NMDA in the absence of TTX (B), and in slices after stimulation by 50 μm each of various ionotropic glutamate agonists (C–F), such as NMDA (C), AMPA (D), and kainic acid (E) and by the metabotropic glutamate agonist DHPG (F) in the presence of TTX in the media. Scale bar, 100 μm. Note the differences in patterns of c-Fos-IR after NMDA stimulation in the absence (B) versus that seen in the presence (C) of TTX and the robust ventral labeling produced by all three ionotropic agonists (C–E) in contrast to the evenly distributed pattern produced by the metabotropic glutamate agonist (F). See Results.
Figure 2.
Figure 2.
Typical patterns of c-Fos expression within the SCN in the presence of 2.5 μm TTX in control slices (A) and in slices after exposure to 0.3 μm VIP (B), 10 μm forskolin (C), or 10 μm serotonin (D). Scale bar, 100 μm.
Figure 3.
Figure 3.
Illustrations of typical patterns of c-Fos-IR (A, C, E) and VP hnRNA expression (B, D, F) in SCN slice explants after 17 d of organotypic culture, in control slices (A, B), in the presence of 2.5 μm TTX for 3 h (C, D), and in slices depolarized for 2 h by 50 mm potassium chloride in the presence of TTX (E, F). For details, see Results. Scale bars: E and F represent 100 μm for A, C, E and B, D, respectively.
Figure 4.
Figure 4.
Effects of 10 μm bicuculline and 2.5 μm TTX on VP hnRNA levels in the SCN in vitro and the stimulation of VP gene expression in TTX by the addition of either 10 μm forskolin (FORSK) or 50 mm KCl to the culture medium. Data are expressed as mean ± SEM percentage of integrated optical density over SCN in control slices. n = 19, 9, 27, 10, and 5 for the control (CON), bicuculline (BICUC), TTX, TTX plus forskolin, and TTX plus KCl groups, respectively. *p < 0.05 versus control group; #p < 0.05 versus TTX-treated group. Statistical differences were calculated by ANOVA, followed by Fisher’s PLSD test.
Figure 5.
Figure 5.
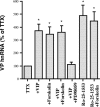
Comparison of the effects of neurotransmitters that are present in the SCN on VP hnRNA expression in the presence of TTX. Effects of the exposure of the SCN in vitro to 0.3 μm VIP, 10 μm serotonin (5HT), or 100–200 nm PACAP-38 on VP hnRNA levels in the SCN compared with TTX controls are shown. Data are expressed as mean ± SEM percentage of integrated optical density over SCN in control slices, in which n = 27, 15, 5, 4, and 4 for the TTX, VIP, serotonin, 100 nm PACAP, and 200 nm PACAP groups, respectively. *p < 0.05 versus the TTX control. Statistical differences were calculated by ANOVA, followed by Fisher’s PLSD test.
Figure 6.
Figure 6.
The effect of VIP on VP hnRNA gene expression in the SCN occurs by activation of a VPAC2 receptor and an MAP kinase signaling pathway. Both 0.3 μm VIP and the VPAC2 receptor-specific agonist, 100 nm Ro-25-1553, are highly effective in stimulating VP gene expression in the SCN in the presence of TTX. The addition of 10 μm forskolin together with either of these agonists does not produce an additive effect. Data are expressed as mean ± SEM percentage of integrated optical density over SCN in TTX-treated slices, in which n = 17, 15, 5, 7, 4, 12, and 3 for the TTX, VIP, forskolin, VIP plus PD98059, VIP plus forskolin, Ro-25-1553, and Ro-25-1553 plus forskolin groups, respectively. *p < 0.05 versus the TTX control. Statistical differences were calculated by ANOVA, followed by Fisher’s PLSD test.
Figure 7.
Figure 7.
Effects of 10 μm forskolin, 5 μm H89 (PKA inhibitor), or the MEK inhibitor PD98059 (75 μm) on forskolin-induced increases of VP hnRNA in the SCN in vitro. In all of these experiments, the medium contained 2.5 μm TTX. Data are expressed as means ± SEM percentage of integrated optical density over SCN in TTX-treated slices. *p < 0.05 versus TTX-treated group. n = 27, 15, 6, 7, and 7 for the TTX, forskolin (FORSK), forskolin plus PD98059, forskolin plus H89, and forskolin plus PD98059 plus H89 groups, respectively. #p < 0.05 versus forskolin-treated group. Statistical differences were calculated by ANOVA, followed by Fisher’s PLSD test. Note that PD98059 but not H89 inhibited the forskolin-induced increase in VP hnRNA.
Figure 8.
Figure 8.
Comparisons of the effects of 50 mm potassium depolarization (KCl) and various glutamate agonists [50 μm NMDA, AMPA, kainate (KAIN), or DHPG] on VP hnRNA levels in the SCN in the presence of TTX. Data are expressed as means ± SEM percentage of integrated optical density over SCN in control slices. n = 27, 5, 4, 4, 4, and 4 for the TTX, KCl, AMPA, kainate, NMDA, and DHPG groups, respectively. *p < 0.05 versus control. Statistical differences were calculated by ANOVA, followed by Fisher’s PLSD test.
Figure 9.
Figure 9.
Effects of inhibition of extracellular and intracellular sources of calcium release and selective kinase inhibitors on the increase of VP hnRNA produced by 50 mm KCl depolarization. All treatments were in the presence of TTX in the media. Inhibition of calcium channels by the nonspecific calcium channel blocker, 200 μm cadmium ion (Cd), and the specific L-type calcium channel blocker, 5 μm nimodipine (NIMO), significantly decreased the VP hnRNA levels in the SCN during potassium depolarization. In contrast, there was no reduction in the VP hnRNA levels by application of 0.2 μm thapsigargin (THAPS). Both the 60 μm KN62 (CaMK kinase) inhibitor and the 75 μm PD98059 (MEK kinase) inhibitor significantly inhibited the KCl-induced increase in VP hnRNA expression. Data are expressed as mean ± SEM percentage of integrated optical density over SCN in KCL stimulated slices. n = 9, 20, 8, 8, 11, and 10 for the TTX, KCl, Cd, nimodipine, KN62, and PD 980959 groups, respectively. *p < 0.05 decrease value versus KCl. Statistical differences were calculated by ANOVA, followed by Fisher’s PLSD test.
Figure 10.
Figure 10.
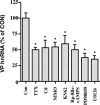
Pharmacological tests of the hypothesis that both calcium-dependent and cAMP/MAP kinase-dependent pathways are involved in the peak of VP gene expression in the SCN. During the peak time of VP gene expression in the SCN in vitro (in the absence of TTX), the following reagents produced inhibition of VP hnRNA expression equivalent to that produced by 2.5 μm TTX (Con). The reagents included a nonspecific calcium channel blocker, 200 μm cadmium ion (Cd), a specific L-type calcium channel blocker, 5 μm nimodipine (NIMO), the CaMK inhibitor, 60 μm KN62, the cell-permeable cAMP inhibitor, 200 μm Rp-Br -cAMPS, the MAPK kinase pathway (MEK) inhibitors, 75 μm PD 980959 and 10 μm U0126; all decreased SCN VP hnRNA levels. Significant changes in VP hnRNA levels were found for all of the treatments shown compared with the untreated control. Data are expressed as means ± SEM percentage of integrated optical density over SCN in control slices (equal to 100%). n = 19, 27, 6, 6, 10, 15, 6, and 5 for the control, TTX, Cd, nimodipine, KN62, Rp-8-Br-cAMPS, PD98059, and U0126 groups, respectively. *p < 0.05 versus control. Statistical differences were calculated by ANOVA, followed by Fisher’s PLSD test.
Figure 11.
Figure 11.
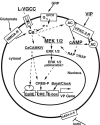
Model of regulation of vasopressin gene expression in the SCN. A schematic representation of potential neurotransmitter ligands and receptors in the VP cell membrane, signal transduction mechanisms, and kinase pathways that are linked to VP gene expression in the SCN is shown. The molecular components and mechanisms that are critical and are supported by pharmacological data presented in this paper are underlined. Two distinct signal transduction cascades are involved: (1) membrane depolarization leading to Ca influx through L-type Ca channels activates both CaMK and MAP kinase pathways, and (2) VIP activation of the VPAC2 receptors on VP neurons is coupled to adenylate cyclase (AC) generation of cAMP, which results in the activation of the MAP kinase pathway. Underlined words and filled arrows depict processes supported by data in this paper or in the literature [e.g., for Bmal/Clock (Jin et al., 1999)], and arrows with dotted lines represent speculative processes. The downstream regulatory component is hypothesized to be phosphorylated CREB and/or unknown activators (?) of not yet identified elements. The temporal pattern of VP expression in the SCN is considered as requiring both a circadian oscillatory component (Bmal/Clock) to open the gate (Ebox) and a neural activity component (VIP and/or spikes) to drive the VP expression (possibly via the CRE) of the VP gene. VGCC, Voltage-gated calcium channel; GPCR, G-protein-coupled receptor; ERK, extracellular signal-regulated kinase; RSK, ribosomal S6 kinase; MSK, mitogen- and stress-activated kinase 1; CaRE, calcium response element; GRP, gastin releasing peptide.

Similar articles

Cited by

References

    1. Antle MC, Foley DK, Foley NC, Silver R. Gates and oscillators: a network model of the brain clock. J Biol Rhythms. 2003;18:339–350. - PMC - PubMed
    1. Arima H, House SB, Gainer H, Aguilera G. Neuronal activity is required for the circadian rhythm of vasopressin gene transcription in the suprachiasmatic nucleus in vitro. Endocrinology. 2002;143:4165–4171. - PubMed
    1. Atkins CM, Nozaki N, Shigeri Y, Soderling TR. Cytoplasmic polyadenylation element binding protein-dependent protein synthesis is regulated by calcium/calmodulin-dependent protein kinase II. J Neurosci. 2004;24:5193–5201. - PMC - PubMed
    1. Aton SJ, Herzog ED. Come together, right.now: synchronization of rhythms in a mammalian circadian clock. Neuron. 2005;48:531–534. - PMC - PubMed
    1. Aton SJ, Colwell CS, Harmar AJ, Waschek J, Herzog ED. Vasoactive intestinal polypeptide mediates circadian rhythmicity and synchrony in mammalian clock neurons. Nat Neurosci. 2005;8:476–483. - PMC - PubMed

Publication types

MeSH terms