. 2007 Jan 3;27(1):203-11.
doi: 10.1523/JNEUROSCI.0445-06.2007.

Nonredundant role of Akt2 for neuroprotection of rod photoreceptor cells from light-induced cell death

Affiliations

Nonredundant role of Akt2 for neuroprotection of rod photoreceptor cells from light-induced cell death

Guiyuan Li et al. J Neurosci. .

Abstract

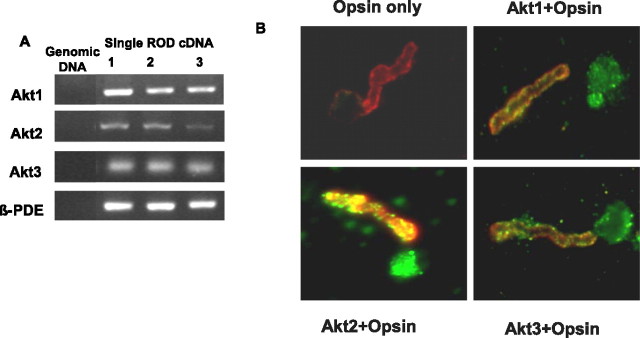
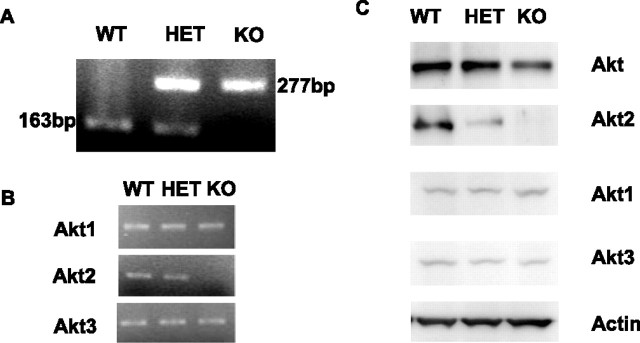
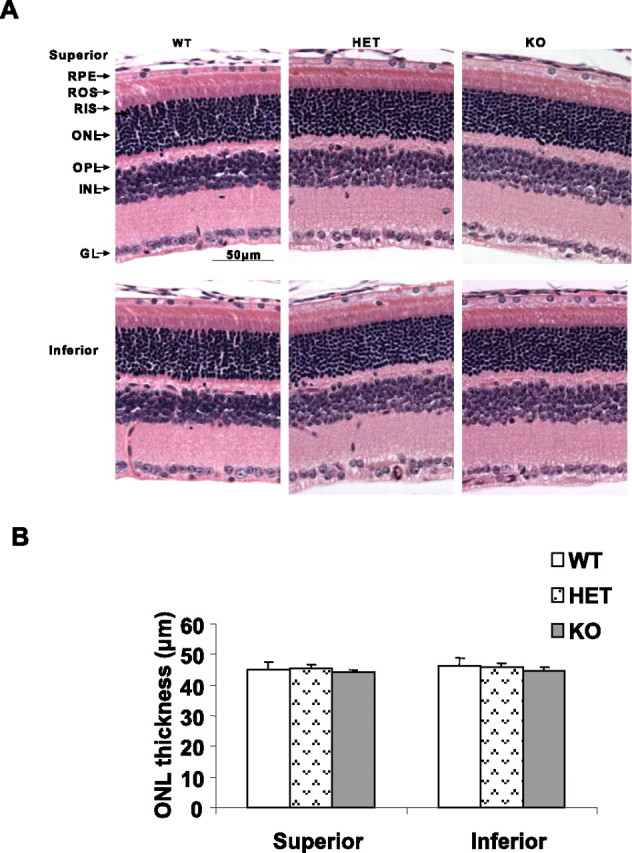
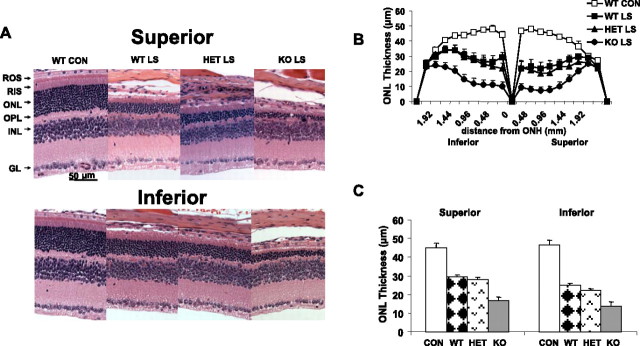
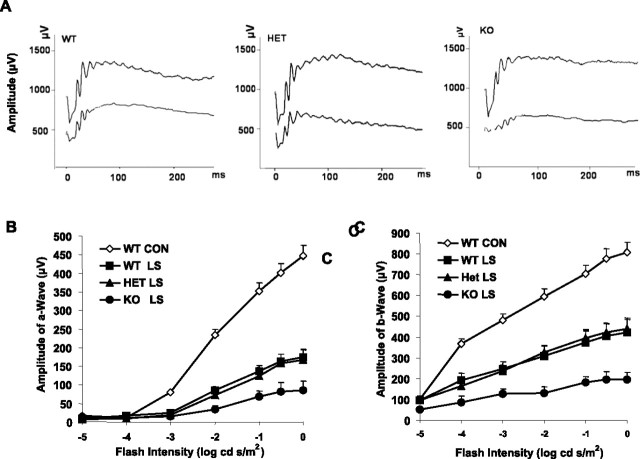
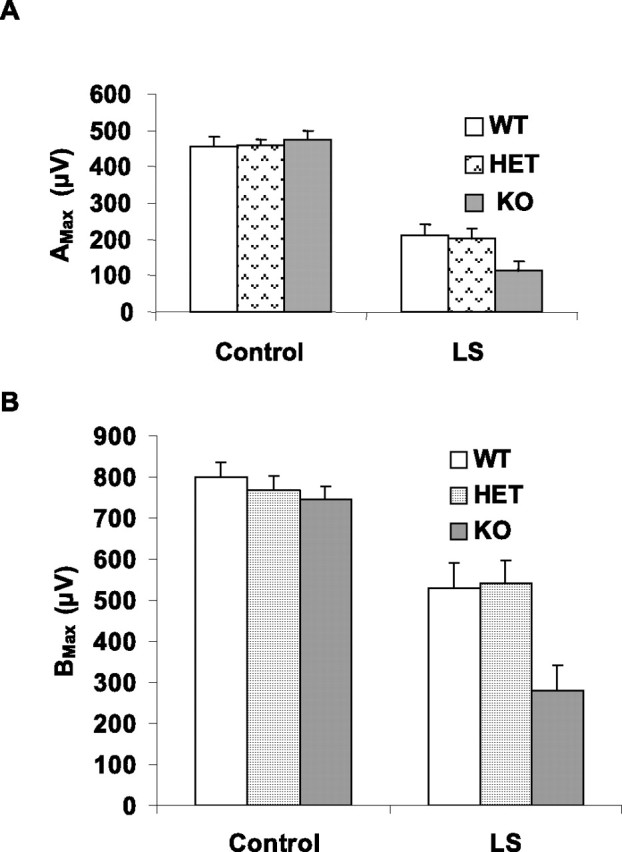
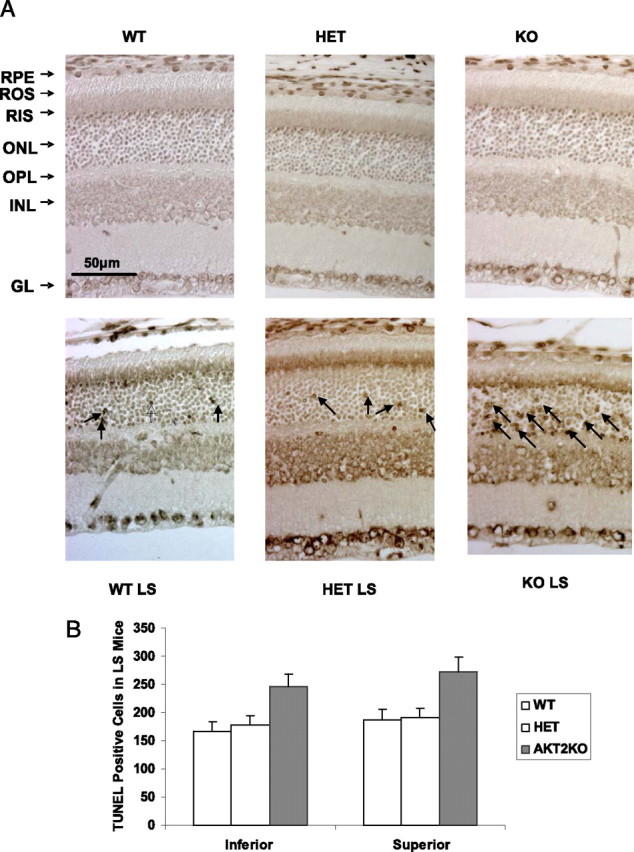
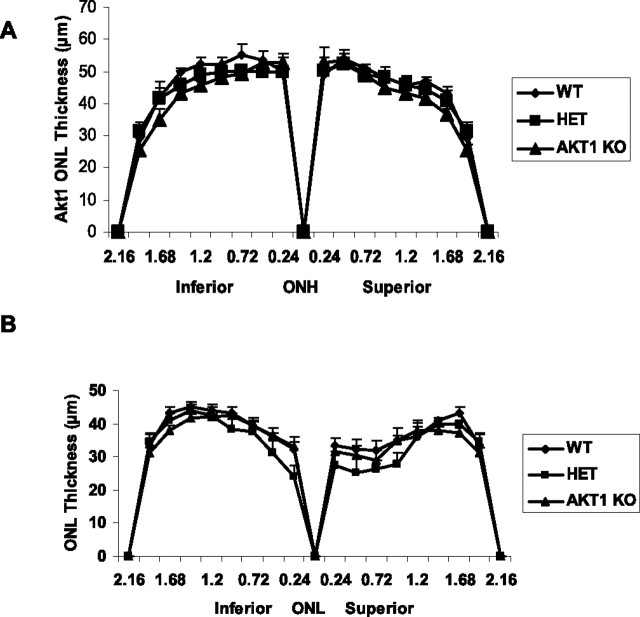
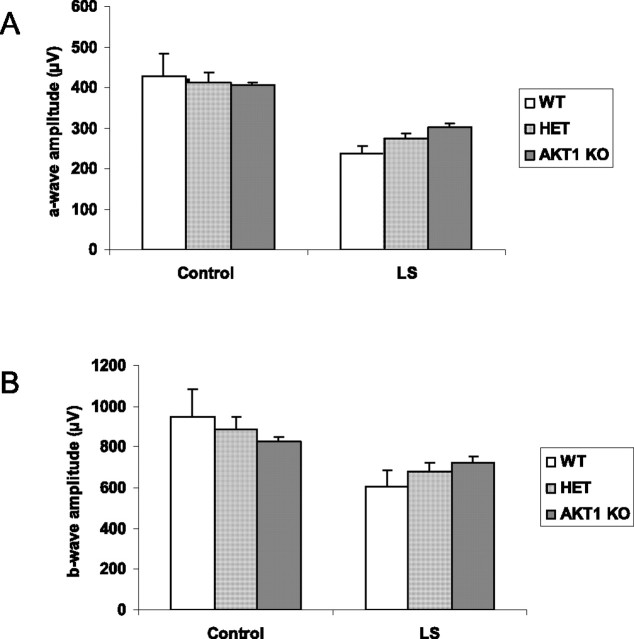
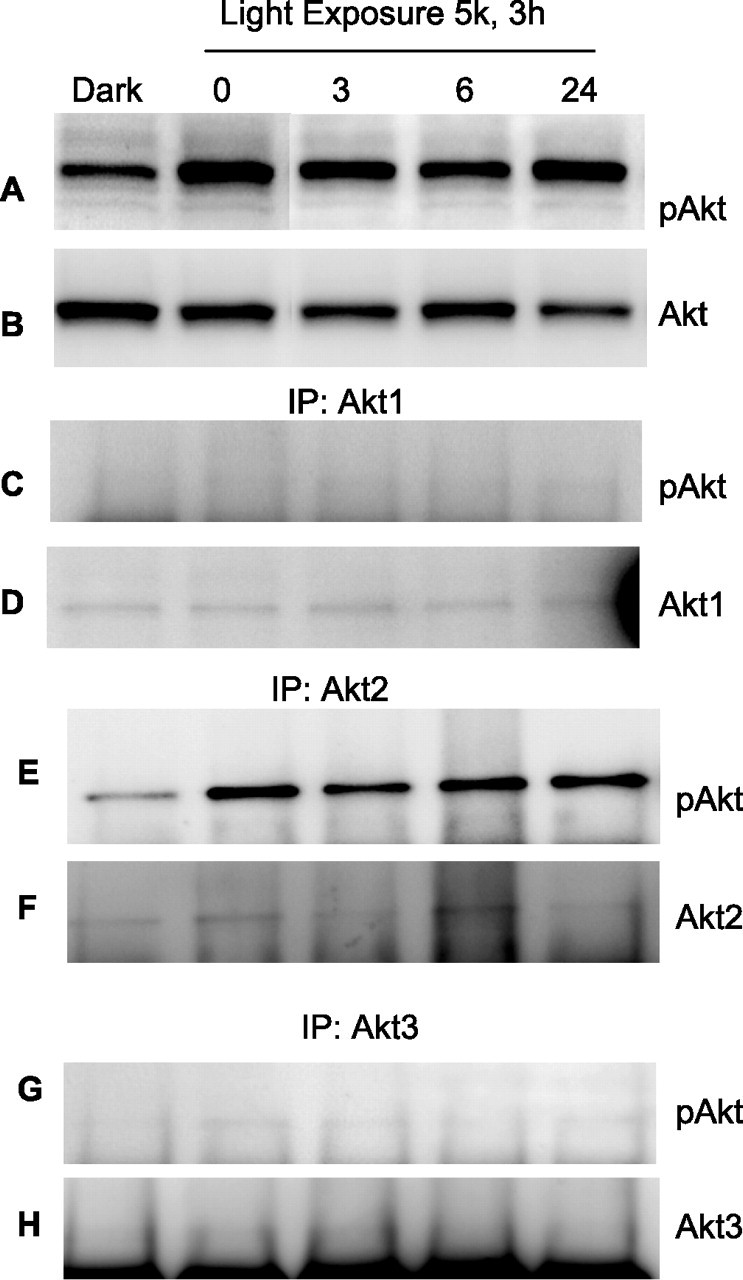
The Akt kinases mediate cell survival through phosphorylation and inactivation of apoptotic machinery components. Akt signaling provides a trophic signal for transformed retinal neurons in culture, but the in vivo role of Akt activity is unknown. In this study, we found that all three Akt isoforms were expressed in rod photoreceptor cells. We investigated the functional roles of Akt1 and Akt2, two of the isoforms of Akt, and their biological significance in light-induced retinal degeneration. Consistent with the hypothesis that Akt activity is important to circumvent stress-induced apoptosis, herein we report the novel finding that rod photoreceptor cells in Akt2 knock-out mice exhibited a significantly greater sensitivity to stress-induced cell death than rods in heterozygous or wild-type mice. Under similar conditions, Akt1 deletion had no effect on the retina. The presence of three Akt isoforms in the retina is suggestive of a functional redundancy; however, our studies clearly demonstrate that, under stress, Akt1 and Akt3 cannot complement the specific survival signals driven by Akt2. Furthermore, we show that Akt2 is specially activated is response to light stress. The results presented in this study provide the first direct evidence that Akt2 has a nonredundant neuroprotective role in photoreceptor survival and maintenance.


Figures

Figure 1.
Figure 1.
Characterization of three Akt isoforms. A, Single rod photoreceptor cell PCR for all three Akt isoforms and β-PDE. Mouse tail genomic DNA served as a control to rule out genomic DNA contamination, and β-PDE was used as a control for the quality of the single-cell cDNA. Results from three single rod photoreceptor cell cDNAs are presented. Akt2, Akt3, and β-PDE were found in all five preparations, and Akt1 was found in three. B, Immunolocalization of Akt1, Akt2, and Akt3 in dissociated ROS (green). Bovine ROS were prepared on glass slides as described in Materials and Methods. Immunolabeling with opsin (red) was used to identify ROS. The colocalization of Akt and opsin (yellow) clearly demonstrates the presence of all three Akt isoforms in rod photoreceptors. We used normal rabbit IgG (Akt2 and Akt3) and goat IgG (Akt1) as controls for primary antibodies. All images were obtained using the same exposure condition and time, which were determined by imaging the control sections until no signal could be obtained.
Figure 2.
Figure 2.
Akt2 expression in the retina of adult mice. A, PCR genotyping of progeny: the WT band and the targeted bands are 163 and 277 bp, respectively. B, RT-PCR assays of the Akt2 KO and WT mice show that mRNA for Akt1 and Akt3, but not for Akt2, is expressed in the KO mice, with the product sizes of 580, 249, and 289 bp for Akt1, Akt2, and Akt3, respectively. C, Western blots of retina lysates (30 μg) from 8-week-old WT, HET, and KO mice separated by 10% SDS-PAGE gels show the absence of Akt2 protein in the Akt2 KO retinas. Actin was used as a loading control.
Figure 3.
Figure 3.
Blood glucose levels of fasting and random-fed mice. A, Blood glucose concentrations from overnight fasted mice. Values are the mean ± SEM for WT (n = 4 males and 4 females), HET (n = 5 males and 5 females), and KO mice (n = 5 males and 6 females). B, Blood glucose concentrations from random-fed mice. Values are the mean ± SEM for WT, HET, and KO mice. Same number of animals were used as in the overnight fasting group. The statistical analysis used for this experiment is one-way ANOVA and unpaired t test.
Figure 4.
Figure 4.
Morphological analysis of Akt2 KO mice born and raised in 60 lux cyclic light. A, Sections are from the superior and inferior regions of the retina of mice at 6–8 weeks of age. Examination of 15 retinas from each group did not reveal any structural differences in any of the retinal cells at the light microscope level. GL, Ganglion cell layer; INL, inner nuclear layer; OPL, outer plexiform layer; RIS, rod inner segment; RPE, Retinal pigment epithelium. B, Quantification of morphologic changes. There were no differences in the average ONL thickness of superior and inferior regions along the vertical meridian of the eye in WT, HET, or KO mice (n = 15 for each group). The statistical analysis used for this experiment is one-way ANOVA and unpaired t test.
Figure 5.
Figure 5.
Morphological analysis of KO mice after light stress. A, Eyes of light-stressed (LS) WT, HET, and KO mice at 6–8 weeks of age were removed 5 d after 26 h continuous light exposure at 3000 lux and were fixed and embedded in paraffin. Representative sections from the superior and inferior retina are shown along with a WT control that was not light stressed. The only difference noted at this magnification was a reduced ONL thickness in all three light-stressed groups, with the greatest loss in nuclei appearing to occur in the KO retinas. GL, Ganglion cell layer; INL, inner nuclear layer; OPL, outer plexiform layer; RIS, rod inner segment. B, Plots of ONL thickness at 0.24 mm intervals from the optic nerve head (ONH) along the vertical meridian in the superior and inferior regions of the retinas of light-stressed WT, HET, and KO mice and from unexposed WT mice. Values are mean ± SEM from 15 mice in each group. C, Quantification of morphologic changes. The average ONL thickness was calculated for the superior and inferior regions of the eye in WT, HET, and KO mice. There was a significantly greater loss of rod nuclei in both hemispheres of the KO retinas compared with WT or HET retinas (p < 0.001). The statistical analysis used for this experiment is one-way ANOVA and unpaired t test.
Figure 6.
Figure 6.
Functional assay of KO mice after light damage. The electroretinogram was recorded from WT controls and three light-stressed groups 5 d after 26 h continuous light exposure at 3000 lux. Values are mean ± SEM from 15 mice in each group. A, Representative ERG tracing from the three groups before and after light stress. The three pairs of ERG tracing are from WT, HET, and KO groups, respectively, from left to right. B, a-Wave of the electroretinogram at seven stimulation intensities. The a-wave amplitude was measured from the resting level to the peak of the cornea-negative deflection, and the b-wave amplitude was measured from the trough of the a-wave to the crest of the cornea-positive response. C, b-Wave of control and light-stressed groups. After light stress, there was a reduction in both a- and b-wave responses in all three groups. The KO response was significantly lower than that of the WT and HET retinas (p < 0.05). The statistical analysis used for this experiment is one-way ANOVA and unpaired t test.
Figure 7.
Figure 7.
ERG sensitivity of WT, HET, and KO mouse retina before and after light stress. A, Amax of WT, HET, and KO groups before and after light stress (LS). B, Bmax of WT, HET, and KO before and after light stress. After light stress, there was a reduction in both a- and b-wave responses in all three groups. The KO response was significantly lower than that of the WT and HET retinas (p < 0.05). The statistical analysis used for this experiment is one-way ANOVA and unpaired t test.
Figure 8.
Figure 8.
TUNEL assay of WT, HET, and KO mouse retinas after light stress. A, Top row, Sections from the superior region of retinas from mice born and raised in 60 lux cyclic light. Bottom row, Sections from the superior region of retinas from mice, taken immediately after exposure to 3000 lux for 26 h. These representative micrographs from five animals per experimental group show increased apoptotic nuclei in the ONL (arrows) in all three groups stressed with bright light, with the greatest number in the KO retinas. No effect of light stress (LS) was seen in any other retinal cell. B, The number of apoptotic cells in each slide was counted and averaged. GL, Ganglion cell layer; INL, inner nuclear layer; OPL, outer plexiform layer; RIS, rod inner segment; RPE, retinal pigment epithelium.
Figure 9.
Figure 9.
Quantification of morphologic changes in Akt1 KO. A, There were no differences in the average ONL thickness of superior and inferior regions along the vertical meridian of the eye in WT, HET, or KO mice (n = 15 for each group). B, Eyes of light-stressed (LS) WT, HET, and Akt1 KO mice at 6–8 weeks of age were removed 5 d after 26 h continuous light exposure at 3000 lux and were fixed and embedded in paraffin. Plots of ONL thickness at 0.24 mm intervals from the optic nerve head (ONH) along the vertical meridian in the superior and inferior regions of the retinas of light-stressed WT, HET, and KO mice. Values are mean ± SEM from 15 mice in each group. The statistical analysis used for this experiment is one-way ANOVA and unpaired t test.
Figure 10.
Figure 10.
ERG sensitivity of WT, HET, and Akt1 KO mouse retina before and after light stress. The ERGs for Akt1 mice were done at the highest intensity used for Akt2 mice settings. The a-wave (A) and b-wave (B) amplitudes of WT, HET, and Akt1 KO mice before and after light stress were measured. After light stress, there was a reduction in both a- and b-wave responses in all three groups. There was no change in either a-wave or b-wave response in KO mice after light stress compared with HET. The statistical analysis used for this experiment is one-way ANOVA and unpaired t test.
Figure 11.
Figure 11.
Activation of Akt isoforms in response to light stress. Rats were subjected to light stress for 3 h at 5000 lux. At the end of light exposure, rats were dark adapted and the retinas were removed 0, 3, 6, and 24 h later. Control experiments were done on overnight dark-adapted rats. Retinas were lysed, and equal amount of protein was subjected to Western blot analysis with anti-pAkt (A) and anti-Akt (B) antibodies. To determine the specific isoform activation in response to stress, we immunoprecipitated (IP) the proteins from light stress samples with anti-Akt1 (D), anti-Akt2 (F), and anti-Akt3 (H) antibodies. The immune complexes were subjected to Western blot analysis with anti-pAkt (C, E, G) antibody.

References

    1. Barber AJ, Nakamura M, Wolpert EB, Reiter CE, Seigel GM, Antonetti DA, Gardner TW. Insulin rescues retinal neurons from apoptosis by a phosphatidylinositol 3-kinase/Akt-mediated mechanism that reduces the activation of caspase-3. J Biol Chem. 2001;276:32814–32821. - PubMed
    1. Bilton RL, Booker GW. The subtle side to hypoxia inducible factor (HIFalpha) regulation. Eur J Biochem. 2003;270:791–798. - PubMed
    1. Brazil DP, Hemmings BA. Ten years of protein kinase B signalling: a hard Akt to follow. Trends Biochem Sci. 2001;26:657–664. - PubMed
    1. Brodbeck D, Cron P, Hemmings BA. A human protein kinase Bgamma with regulatory phosphorylation sites in the activation loop and in the C-terminal hydrophobic domain. J Biol Chem. 1999;274:9133–9136. - PubMed
    1. Brozinick JT, Jr, Roberts BR, Dohm GL. Defective signaling through Akt-2 and -3 but not Akt-1 in insulin-resistant human skeletal muscle: potential role in insulin resistance. Diabetes. 2003;52:935–941. - PubMed

Publication types

MeSH terms