Review
. 2007 Feb;5(2):141-51.
doi: 10.1038/nrmicro1594. Epub 2007 Jan 4.

Is HIV-1 evolving to a less virulent form in humans?

Affiliations
Review

Is HIV-1 evolving to a less virulent form in humans?

Kevin K Ariën et al. Nat Rev Microbiol. 2007 Feb.

Abstract

During the rapid spread of HIV-1 in humans, the main (M) group of HIV-1 has evolved into ten distinct subtypes, undergone countless recombination events and diversified extensively. The impact of this extreme genetic diversity on the phenotype of HIV-1 has only recently become a research focus, but early findings indicate that the dominance of HIV-1 subtype C in the current epidemic might be related to the lower virulence of this subtype compared with other subtypes. Here, we explore whether HIV-1 has reached peak virulence or has already started the slow path to attenuation.


Conflict of interest statement

The authors declare no competing financial interests.

Figures
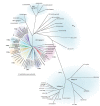
Figure 1
Figure 1. Phylogenetic tree of human and simian lentiviruses.
The genetic similarity between different HIV and simian immunodeficiency virus (SIV) strains was compared by aligning the full genome sequences of 87 human and simian lentiviruses using ClustalX v.1.83 (the accession numbers are available on request). Phylogenetic trees based on nucleotide distance were constructed by neighbour-joining methods as implemented in ClustalX with 1,000 bootstrap resamplings (not presented) and schematically represented with the TreeView program. HIV-2 and HIV-1 share only 50–60% sequence identity and cluster at distinct locations on the phylogenetic tree whereas SIVcpz branches out from the root of the HIV-1 groups. The origins of these HIV-1 groups in southern Cameroon have recently been described and indicate two probable jumps from chimpanzee (groups M and N) and gorilla (group O) species. HIV-1 M subtypes probably evolved from a discrete introduction into the human population and then diverged into different subtypes. The subtypes defined as 'A-like' describe HIV-1 isolates with sequences that map phylogenetically more to subtype A than to any other subtype. For example, the recombinant form CRF02_AG (such as 02 AG.NG.IBNG in the HIV-1 group M A-like cluster) has longer genomic segments that are more related to subtype A than to subtype G. M, main; N, new.
Figure 2
Figure 2. A hypothetical example of changes in replicative fitness and viral load during HIV-1 disease progression.
An individual is typically infected by a few HIV-1 clones (depicted by a small green circle), which dramatically increase in copy number but not in genetic diversity during the first 1–2 months of infection. Following this acute infection period, viral load is reduced partly as a result of strong HIV-specific cell-mediated immunity. The virus population is thought to oscillate between expansion of HIV-1 populations owing to immune escape from existing HIV-specific cytotoxic T-lymphocyte (CTL) clones and contraction caused by new genetic bottlenecks that are induced by newly emerging CTL clones. The replicative fitness and genetic diversity of the HIV-1 population seem to track closely together and, following early disease (purple box), both increase at a relatively linear rate with the length of infection. This increase in replicative fitness correlates with increases in viral loads (right axis) and decreases in CD4+ T-cell counts (not shown). The scale for replicative fitness is arbitrary but is derived from the relative HIV-1 fitness values, that is, the ability of one HIV-1 isolate to out-compete another in ex vivo dual-virus competition experiments.
Figure 3
Figure 3. HIV-1 diversity in the worldwide epidemic.
The frequency of each HIV-1 subtype and recombinant form was estimated in each country based on published findings. A complete breakdown of subtype prevalence per country and the countries present in each region are listed in the Supplementary information S1 (table). The countries are colour-coded based on the dominant HIV-1 group main (M) subtype. The countries coloured grey have a low level of HIV-1 prevalence or were not represented in the scientific literature related to HIV-1 subtype prevalence. The pie charts depict the proportion of each subtype or recombinant form in each geographical region. The size of the pies is proportional to the number of HIV-1 infected individuals in that particular region.
Figure 4
Figure 4. Relationship between the increasing prevalence of HIV-1 subtype C and its low pathogenic fitness.
The prevalence of HIV-1 subtype C or subtype C-containing recombinant forms has increased in proportion to other HIV-1 subtypes in Rio do Sul, Brazil (from 35% in 1996 to 52% 2002), in Kinshasa and Mbuji-Mayi, Democratic Republic of Congo (DRC) (from 2.1% and 16.3% in 1997 to 9.7% and 25% in 2002, respectively) and in Yunnan, China (from 5.1% in 1992 to 90% in 2002),. By contrast, subtype C is dominant in South Africa and did not increase in proportion to subtypes A and D or recombinant forms in Kenya. The number of HIV-1 cases increased in all of these regional epidemics (except in Kinshasa). a | The number of HIV-1 infections in specific years is subdivided into subtype C (yellow) and non-subtype-C (maroon) HIV-1 infections. b | A schematic representation of the pathogenic fitness of human lentiviruses, derived from >3,000 pair-wise dual HIV-1 competition experiments,,,,,,,,. The coloured ovals plot the fitness of primary HIV-1 isolates competed against isolates of the same type, group or subtype (y axis; mean fitness of 1 or equal fitness) compared with the fitness of primary HIV-1 isolates competed against isolates of different types, groups or subtypes. Each oval encompasses the fitness (x and y fitness values) of at least 10 to 20 primary HIV-1 isolates. M, main; O, other.

Comment in

  • HIV-1 over time: fitness loss or robustness gain?
    Rolland M, Brander C, Nickle DC, Herbeck JT, Gottlieb GS, Campbell MS, Maust BS, Mullins JI. Rolland M, et al. Nat Rev Microbiol. 2007 Sep;5(9):C1. doi: 10.1038/nrmicro1594-c1. Nat Rev Microbiol. 2007. PMID: 17703224 No abstract available.

Similar articles

Cited by

References

    1. Lemey P, Pybus OG, Van DS, Vandamme AM. A Bayesian statistical analysis of human T-cell lymphotropic virus evolutionary rates. Infect. Genet. Evol. 2005;5:291–298. - PubMed
    1. Van DS, Salemi M, Vandamme AM. Dating the origin of the African human T-cell lymphotropic virus type-i (HTLV-I) subtypes. Mol. Biol. Evol. 2001;18:661–671. - PubMed
    1. Yoshida M. Discovery of HTLV-1, the first human retrovirus, its unique regulatory mechanisms, and insights into pathogenesis. Oncogene. 2005;24:5931–5937. - PubMed
    1. Coulthart MB, Posada D, Crandall KA, Dekaban GA. On the phylogenetic placement of human T cell leukemia virus type 1 sequences associated with an Andean mummy. Infect. Genet. Evol. 2006;6:91–96. - PMC - PubMed
    1. Korber B, et al. Timing the ancestor of the HIV-1 pandemic strains. Science. 2000;288:1789–1796. - PubMed