. 2007 Feb 23;282(8):5661-9.
doi: 10.1074/jbc.M608499200. Epub 2007 Jan 4.

Convergence of p53 and transforming growth factor beta (TGFbeta) signaling on activating expression of the tumor suppressor gene maspin in mammary epithelial cells

Affiliations

Convergence of p53 and transforming growth factor beta (TGFbeta) signaling on activating expression of the tumor suppressor gene maspin in mammary epithelial cells

Shizhen Emily Wang et al. J Biol Chem. .

Abstract

Using two-dimensional difference gel electrophoresis, we identified the tumor suppressor gene maspin as a transforming growth factor beta (TGFbeta) target gene in human mammary epithelial cells. TGFbeta up-regulatesMaspin expression both at the RNA and protein levels. This up-regulation required Smad2/3 function and intact p53-binding elements in the Maspin promoter. DNA affinity immunoblot and chromatin immunoprecipitation revealed the presence of both Smads and p53 at the Maspin promoter in TGFbeta-treated cells, suggesting that both transcription factors cooperate to induce Maspin transcription. TGFbeta did not activate Maspin-luciferase reporter in p53-mutant MDA-MB-231 breast cancer cells, which exhibit methylation of the endogenous Maspin promoter. Expression of ectopic p53, however, restored ligand-induced association of Smad2/3 with a transfected Maspin promoter. Stable transfection of Maspin inhibited basal and TGFbeta-stimulated MDA-MB-231 cell motility. Finally, knockdown of endogenous Maspin in p53 wild-type MCF10A/HER2 cells enhanced basal and TGFbeta-stimulated motility. Taken together, these data support cooperation between the p53 and TGFbeta tumor suppressor pathways in the induction of Maspin expression, thus leading to inhibition of cell migration.


Figures

Fig. 1
Fig. 1
Characterization of maspin as a TGFβ target gene. A, MCF10A/HER2 cells were treated with 2 ng/ml of TGFβ for 0, 8, 24 or 40 h before lysis followed by 2D-DIGE. DIGE was carried out as described in Experimental Procedures using samples collected from 3 separate experiments. The two species of maspin protein are encircled by the white lines. Two gels (0 and 40 h) are shown to indicate the positions of the two forms of maspin. The average ratio (compared to 0 h) and T-test value at each time point are summarized in the graphs in the right panel. B, MCF10A and MCF10A/HER2 cells were treated with TGFβ for 0-40 h. Cell lysates were prepared, separated by SDS-PAGE, and subjected to immunoblot analysis with the indicated antibodies as described in Experimental Procedures. C, HMEC and NMuMG cells were treated with TGFβ for 24 h or left untreated. Immunoblot of cell lysates was performed using maspin and actin antibodies.
Fig. 2
Fig. 2
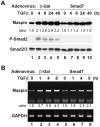
TGFβ up-regulates maspin expression via the Smad pathway. MCF10A cells growing on 6-well plates were infected with adenoviruses encoding Smad7 or β-Gal (MOI:15). Twenty-four h after infection, cells were treated with TGFβ, harvested at the indicated times, and then subjected to immunoblot analysis with the indicated antibodies (A) or RNA extraction and RT-PCR (B) as indicated in Experimental Procedures. GAPDH was amplified and used as an internal control in the RT-PCR. The protein and cDNA bands of maspin were quantified and shown as their ratio to untreated control samples (below 1st row in both A and B).
Fig. 3
Fig. 3
p53 and Smads cooperate to activate maspin transcription. A, 293 cells were transiently transfected with maspin promoter luciferase reporters and 8 h later treated or not with TGFβ. Twenty-four h after the addition of TGFβ, the cells were harvested and tested for luciferase expression as indicated in Experimental Procedures. Each bar represents the mean normalized luciferase activity ± S.D. calculated from 3 wells. The TGFβ responsive p3TP-Luc reporter was used as a control. B, For DNA affinity immunoblot (DAI) assay, biotin-labeled maspin promoter (lanes 1-4) or biotin-labeled maspin promoter with a mutation at the p53 binding site (p53-I; lanes 5-8) were incubated with nuclear extracts from MCF10A cells that had been treated or not with TGFβ for 1 h. Where indicated, a 10-fold excess of unlabeled (CAGA)12 competitor DNA (lanes 3,4,7,8) was added to the incubation mix. Input nuclear extracts were also loaded (lanes 9&10). The presence of Smads and p53 on maspin promoter DNA was detected in Streptavidin pulldowns subjected to immunoblot analysis using specific antibodies. A c-Jun antibody was used as a negative control. C, MCF10A cells were treated with TGFβ at the indicated times prior to ChIP. After precipitation with the antibodies indicated to the left, primers encompassing maspin promoter region from -154 to +87 were used for PCR amplification. The c-Jun antibody was used as a negative control. To control for equal chromatin input, cell lysates before immunoprecipitation were used as templates for PCR (top 4 rows). When primers encompassing a 194-bp maspin coding region were used for PCR, an amplified PCR product was not detectable in any of the ChIP samples (bottom 3 rows).
Fig. 4
Fig. 4
Mutations of p53 sites in the maspin promoter impair TGFβ-induced transcription. A, Sequence of the maspin promoter region from -297 to +87. Potential Smad binding elements (SBEs) are marked with the solid-line boxes; the two p53 binding sites p53-I [reported by Zou et al.(16)] and p53-II (first identified in this paper) are indicated by the dotted lines. B, EMSA showing that p53 and Smads bind to the p53-II/SBE-II site in the maspin promoter. Annealed p53-II, mtp53-II and mtp53-IIS probes were end-labeled with 32P-ATP and incubated with the nuclear extracts of MCF10A cells (± TGFβ for 1 h). No nuclear extract was added in the negative control (lanes 1, 6, 9). Antibody against p53 or Smad4 was used to generate the supershifted bands (lanes 4, 5). S: specific band; SS: supershifted band. C, Schematic representations of the maspin promoter luciferase reporters and their response to TGFβ. All of the maspin promoter reporters have the common 3’ ends (+87) and different truncated 5’ ends. MCF10A cells were transiently transfected with maspin promoter reporters and 8 h later treated or not with TGFβ. At 24 h, the cells were harvested and tested for luciferase reporter activity as indicated in Experimental Procedures. Each bar represents the mean normalized luciferase activity ± S.D. calculated from 3 wells. D, MCF10A cells were transiently co-transfected with maspin promoter reporters (-154, -154mtp53-II or -154mtp53-IIS), a p53 plasmid or a control vector. Eight h post-transfection, cells were treated or not with TGFβ; 24 h later, the cells were harvested and tested in a luciferase reporter assay. Fold activation by p53 was calculated based on the luciferase activity in vector-transfected cells which is set at 1. Each bar represents the mean normalized luciferase activity ± S.D. calculated from 3 wells.
Fig. 5
Fig. 5
TGFβ fails to activate maspin promoter in p53-mutant cells. A, MDA-MB-231 cells were transiently transfected with 0.5 μg of pM-Luc(-297), together with 1 μg of w.t. p53 plasmid pCEP4-P53 or empty vector DNA, and 8 h later treated or not with TGFβ. The Smad reporter plasmid p(CAGA)12-Luc was used as a positive control. After 24 h, the cells were harvested and then tested in a luciferase reporter assay. Each bar represents the mean normalized luciferase activity ± S.D. calculated from 3 wells. B, MDA-MB-231 cells grown on 100 mm dishes were co-transfected with 2 μg of pM-Luc(-759) and 5 μg of pCEP4-P53 (lanes 4-6) or empty vector DNA (lanes 1-3). Cells were treated with TGFβ for 0, 30 min or 1 h prior to ChIP. DNA-protein complexes were precipitated with the antibodies indicated to the left of each panel followed by PCR amplification using primers specific to the maspin promoter as indicated in Experimental Procedures. To control from chromatin input, whole cell lysates (before the antibody pulldown) were used as templates for the PCR (bottom row). C, MDA-MB-231 cells stably transfected with maspin or control vector were treated or not with TGFβ for 24 h. Cell lysates were separated by SDS-PAGE followed by immunoblot analysis with the indicated antibodies. D, Close-to-confluent monolayers of MDA-MB-231 cells stably expressing maspin or control vector were serum-starved for 24 h before wounding. Serum-free medium ± TGFβ was replenished and wound closure was followed 20 h later as indicated in Experimental Procedures. E, MDA-MB-231 cells stably expressing maspin or control vector were seeded (2.5×10⁴ cells/well) on Matrigel-coated transwells and allowed to invade toward growth medium ± TGFβ. At 24 h, the cells invading into the Matrigel were counted; each bar represents the mean ± S.D. of 3 wells.
Fig. 6
Fig. 6
Knock-down of maspin facilitates TGFβ-induced motility. A, Parental and MCF10A/HER2 cells stably expressing maspin siRNA (si-msp) or control siRNA were treated with TGFβ for 24 h. Cell lysates were prepared and subjected to immunoblot analysis with maspin and actin antibodies. B, Close-to-confluent monolayers of MCF10A/HER2 cells expressing maspin siRNA or control siRNA were serum-starved for 40 h before wounding. Serum-free medium ± TGFβ was replenished and wound closure was recorded at 10 and 20 h. C, MCF10A/HER2 cells were grown in medium with or without TGFβ for 24 h and then subjected to immunofluorescence assay (IFA) as indicated in Experimental Procedures. IFA shows vinculin-containing focal adhesions. DAPI, nuclear staining. D, MCF10A/HER2 cells expressing siRNAs were seeded (2.5×10⁴ cells/well) on Matrigel-coated transwells and allowed to invade toward growth medium ± TGFβ. At 24 h, the cells invading into the Matrigel were counted; each bar represents the mean ± S.D. of 3 wells.

Similar articles

Cited by

References

    1. Massague J, Blain SW, Lo RS. Cell. 2000;103(2):295–309. - PubMed
    1. Siegel PM, Massague J. Nat Rev Cancer. 2003;3(11):807–820. - PubMed
    1. Wakefield LM, Roberts AB. Curr Opin Genet Dev. 2002;12(1):22–29. - PubMed
    1. Massague J, Seoane J, Wotton D. Genes Dev. 2005;19(23):2783–2810. - PubMed
    1. Arteaga CL. Curr Opin Genet Dev. 2006;16(1):30–37. - PubMed

Publication types

MeSH terms