. 2007 Mar 15;579(Pt 3):657-70.
doi: 10.1113/jphysiol.2006.120733. Epub 2007 Jan 4.

Permeating protons contribute to tachyphylaxis of the acid-sensing ion channel (ASIC) 1a

Affiliations

Permeating protons contribute to tachyphylaxis of the acid-sensing ion channel (ASIC) 1a

Xuanmao Chen et al. J Physiol. .

Abstract

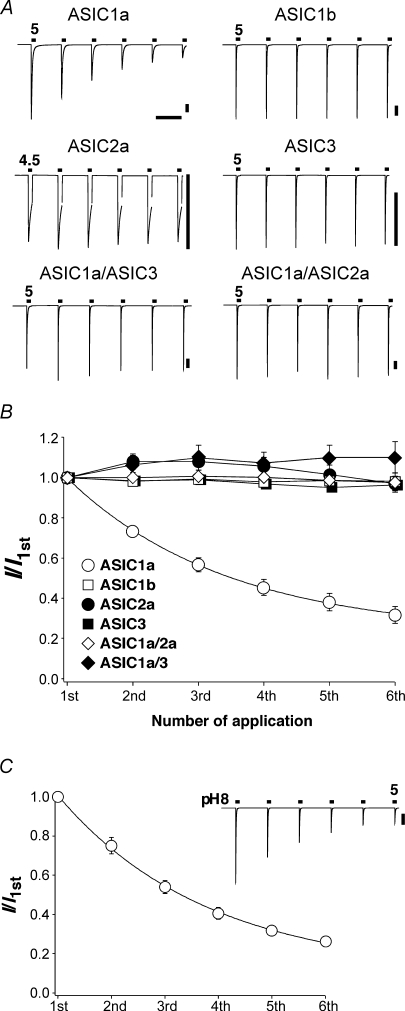
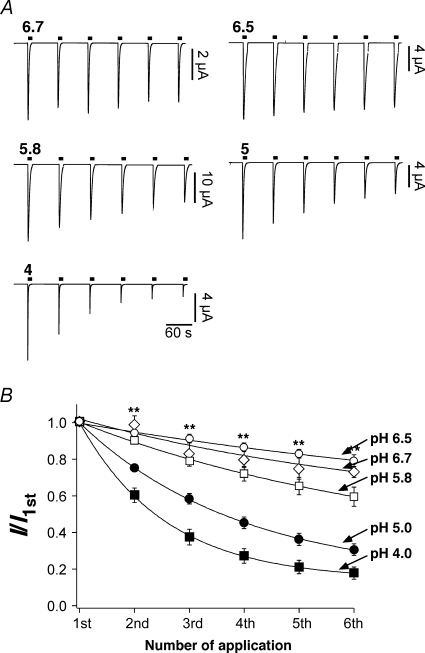
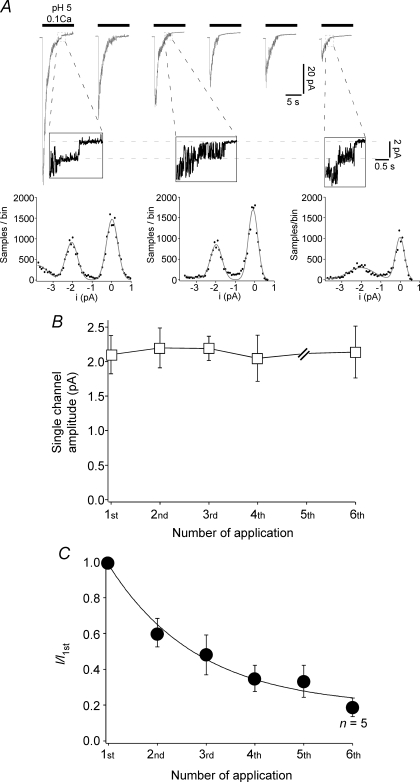
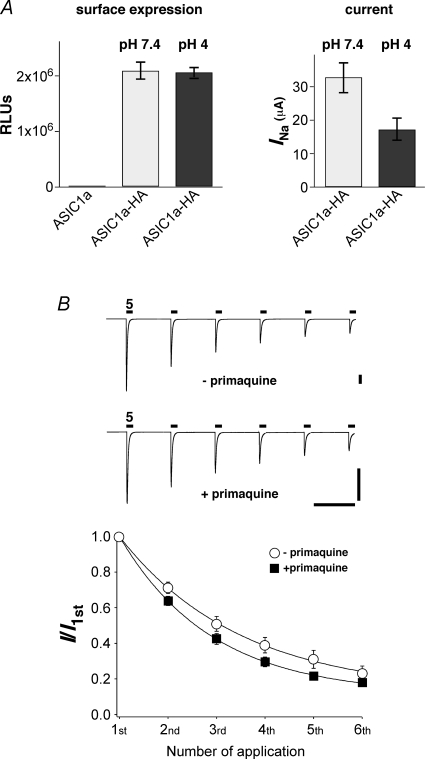
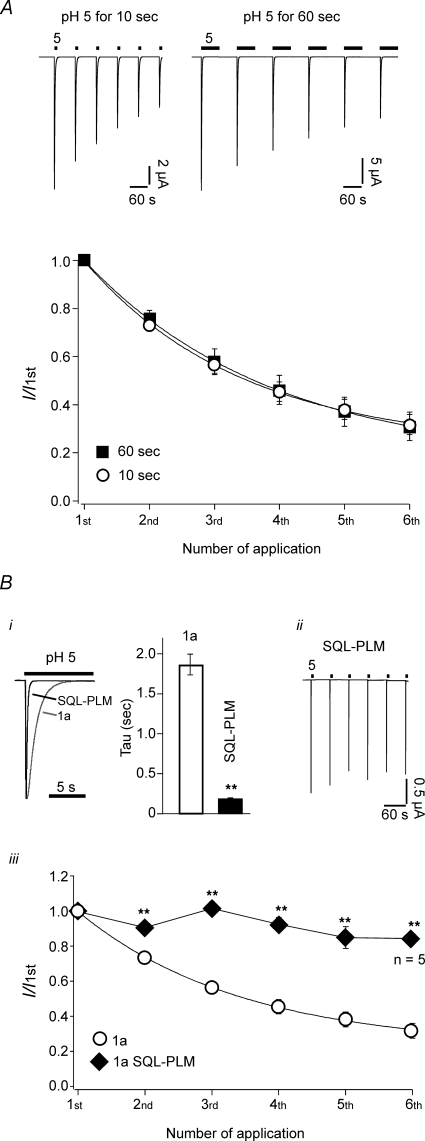
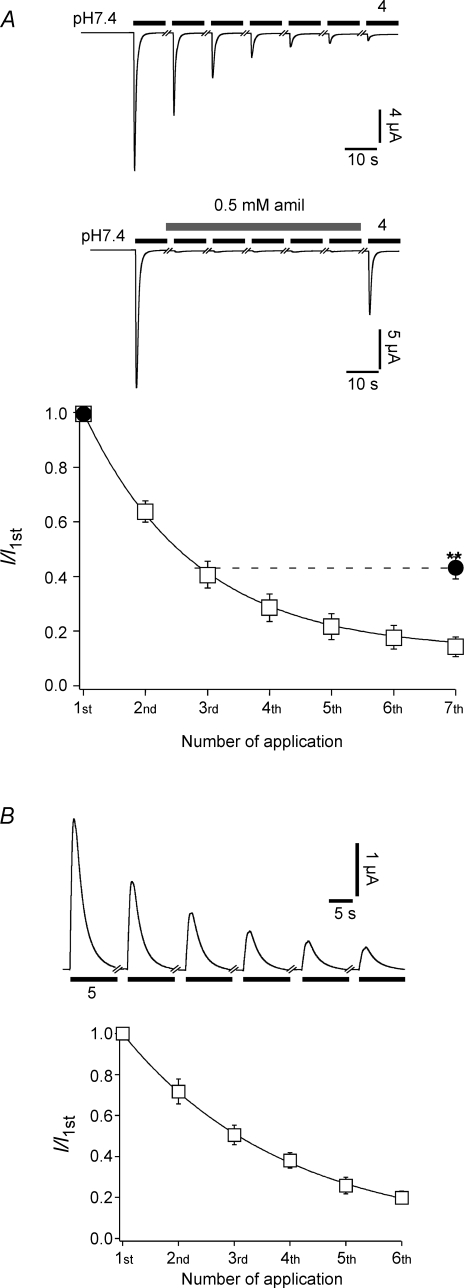
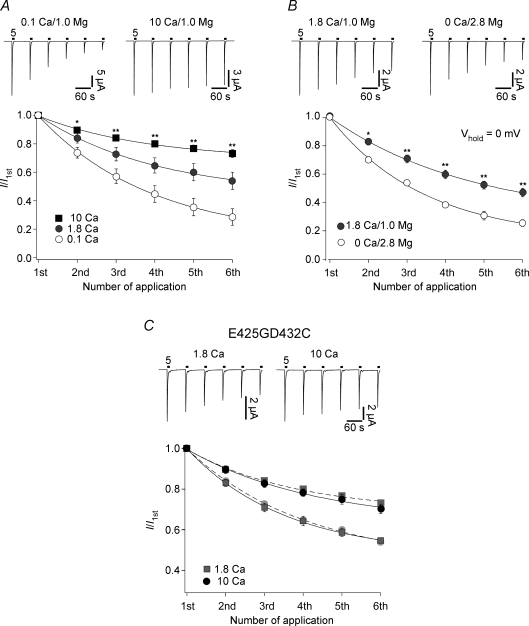
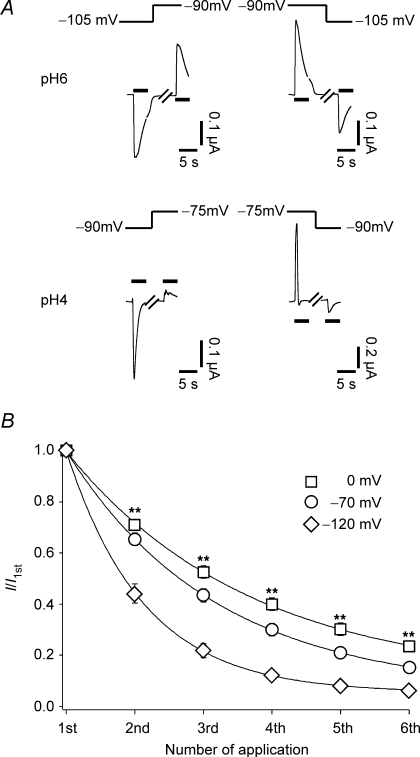
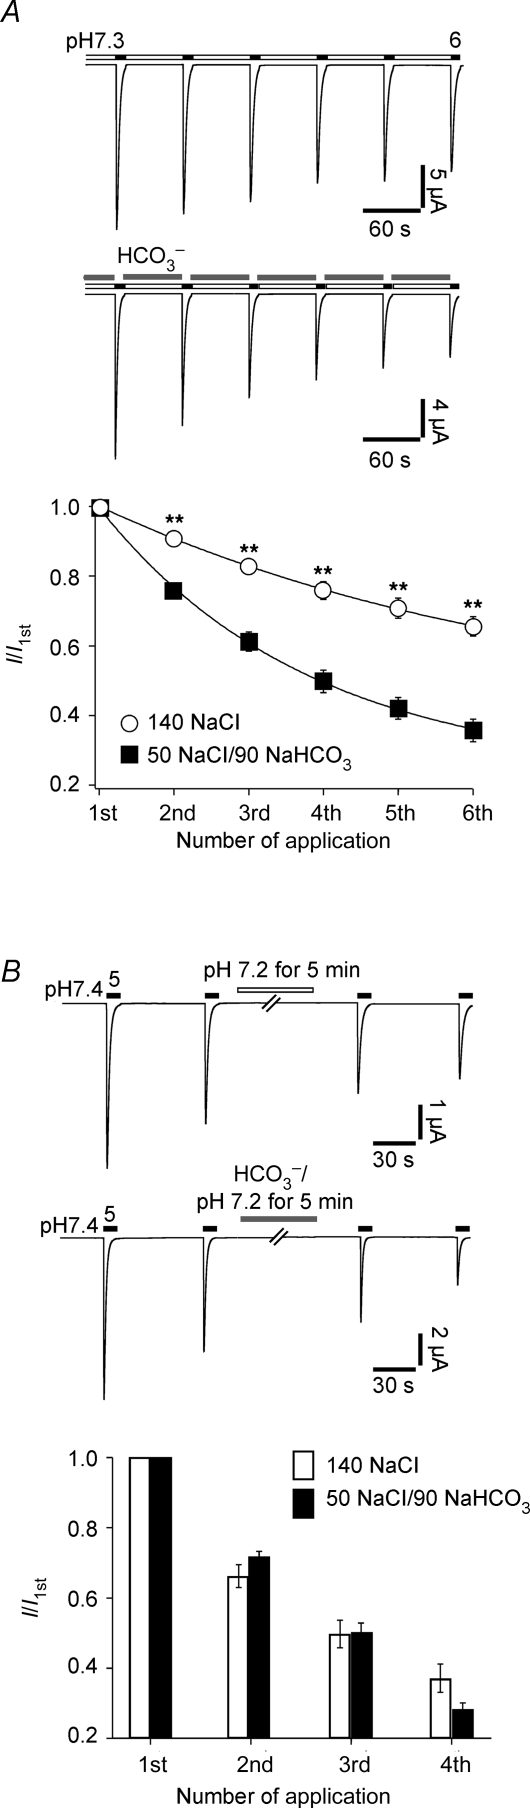
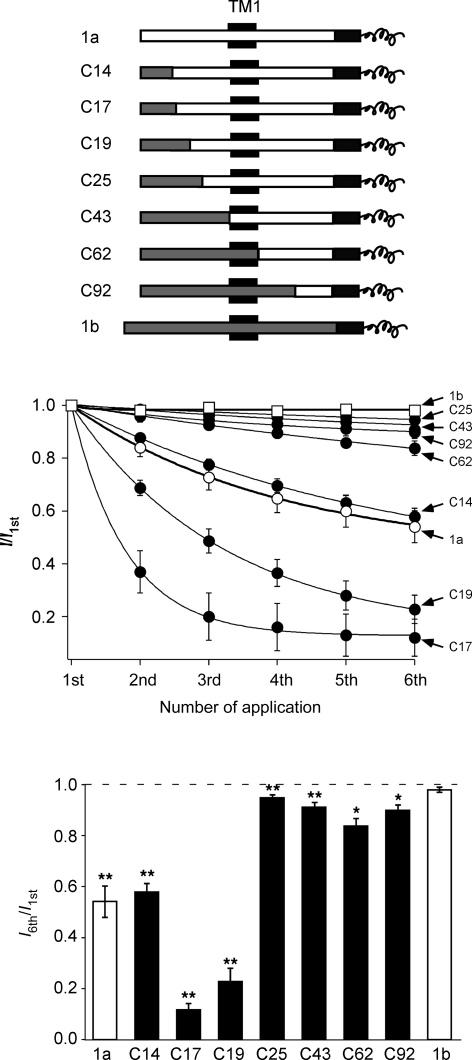
The homomeric acid-sensing ion channel 1a (ASIC1a) is a H+-activated ion channel with important physiological functions and pathophysiological impact in the central nervous system. Here we show that homomeric ASIC1a is distinguished from other ASICs by a reduced response to successive acid stimulations. Such a reduced response is called tachyphylaxis. We show that tachyphylaxis depends on H+ permeating through ASIC1a, that tachyphylaxis is attenuated by extracellular Ca2+, and that tachyphylaxis is probably linked to Ca2+ permeability of ASIC1a. Moreover, we provide evidence that tachyphylaxis is probably due to a long-lived inactive state of ASIC1a. A deeper understanding of ASIC1a tachyphylaxis may lead to pharmacological control of ASIC1a activity that could be of potential benefit for the treatment of stroke.


Figures

Figure 1
Figure 1
Currents of homomeric ASIC1a exhibit tachyphylaxis A, representative examples of currents from homomeric ASIC1a, -1b, -2a and –3, and from heteromeric –1a/3 and –1a/2a. ASICs were repeatedly activated by application of pH 5 (pH 4.5 for ASIC2a) for 10 s. Channels were allowed to recover in conditioning pH 7.4 for 60 s. The measurements with ASIC1a/ASIC3 were done in the presence of 40 nm PcTx1 (see Methods). Bars correspond to 60 s and 2 μA, respectively. B, current amplitudes were normalized to the first amplitude. The depression of the ASIC1a current amplitude could be well fitted with a single exponential function (continuous line). ASIC1a, n = 10; ASIC1b, n = 6; ASIC2a, n = 7; ASIC3, n = 7; ASIC1a/3, n = 7; ASIC1a/2a, n = 9. C, ASIC1a was repeatedly activated as in A, but the conditioning pH was pH 8.0. n = 11.
Figure 2
Figure 2
Tachyphylaxis is pH dependent A, representative traces of ASIC1a currents induced by different extracellular pH values. B, current amplitudes were normalized to the first amplitude. Continuous lines represent fits to a single exponential function. **P < 0.001 by one-way ANOVA test. pH 6.7, n = 7; pH 6.5, n = 9; pH 5.8, n = 9; pH 5, n = 7; pH 4, n = 15.
Figure 3
Figure 3
Tachyphylaxis is not due to a reduction of the single channel amplitude A, top, representative current traces recorded from one excised outside-out patch. ASIC1a was repeatedly (six times) activated for 10 s with pH 5. Between each application, channels could fully recover from acute desensitization by application for 60 s of pH 7.4. Activation solution had a reduced Ca2+ concentration (0.1 mm), whereas conditioning solution contained 1.8 mm Ca2+ (in addition, both contained 1 mm Mg2+). Holding potential was –70 mV. At the end of the open phase, single channel events can be observed. For the 1st, 3rd and 6th application, they are shown at higher magnification below the respective trace. Bottom, amplitude histogram of parts of the magnified segments shown above. Amplitude distribution was fitted with a sum of Gaussian functions. B, single channel amplitudes, analysed as shown in A, as a function of the number of acid applications. n = 4–6 individual patches. The fifth application was not analysed due to a low number of discernible single channels. There was no significant change of the single channel amplitude during repetitive low pH stimulation (P = 1 by ANOVA). C, analysis of the peak current amplitude in outside-out patches as a function of the number of acid application. The continuous line is a fit with a mono-exponential function. If not specified differently, n = 7. Recordings with peak current amplitudes ranging from 22 pA to 100 pA (first activation) were analysed. P < 0.001 by ANOVA.
Figure 4
Figure 4
Tachyphylaxis is not caused by endocytosis A, left, surface expression of HA-tagged ASIC1a that had been exposed six times to pH 7.4 or pH 4. Untagged ASIC1a served as a control (first column). Results are expressed as relative light units (RLUs) per oocyte. ASIC1a, n = 18; ASIC1a-HA, pH 7.4, n = 17; ASIC1a-HA, pH 4, n = 25. Right, current amplitude of HA-tagged ASIC1a that were treated in a similar way as oocytes for which surface expression was determined. ASIC1a-HA, pH 7.4, n = 13; ASIC1a-HA, pH 4, n = 15. P = 0.01 by t test. B, top, ASIC1a channels were repeatedly activated by pH 5 for 10 s in the absence or presence of 1 mm primaquine. In both conditions, channels were allowed to recover at pH 7.4 for 60 s. Oocytes in the presence of primaquine had been preincubated in primaquine for 4 h. Bars correspond to 60 s and 1 μA, respectively. Bottom, current amplitudes were normalized to the first amplitude. Continuous lines represent fits to a single exponential function. There was no significant difference between the two conditions. –primaquine, n = 6; +primaquine, n = 7.
Figure 5
Figure 5
Tachyphylaxis occurs from the channels open state A, top, ASIC1a channels were repeatedly activated by pH 5 for 10 s (left) or 60 s (right). In both conditions, channels were allowed to recover at pH 7.4 for 60 s. Bottom, current amplitudes were normalized to the first amplitude. Continuous lines represent fits to a single exponential function. 10 s application, n = 10; 60 s application, n = 8. Bi, comparison of desensitization of wt ASIC1a with mutant SQL(83-85)-PLM. The desensitization time constant of ASIC1a wt and SQL-PLM were 1.9 ± 0.1 s (n = 10) and 0.17 ± 0.02 s (n = 10), respectively. ii, representative current traces of repetitive activation with pH 5 of mutant SQL-PLM. iii, current amplitudes were normalized to the first amplitude. For ASIC1a, continuous line represents a fit to a single exponential function. **P < 0.001 by t test. If not specified differently, n = 10 for ASIC1a wt and n = 11 for ASIC1a SQL-PLM.
Figure 6
Figure 6
Blockage of the open pore reduces tachphylaxis A, top, ASIC1a was repeatedly activated with pH 4 either in the absence or in the presence of amiloride, as indicated. Bottom, current amplitudes were normalized to the first amplitude. Continuous line represents a fit to a single exponential function. For the series to assess the effect of amiloride, only the amplitudes of the amiloride-free applications (1st and 7th) are shown. n = 12 without amiloride and n = 9 with amiloride. **P < 0.001 by t test. B, outward currents do show tachyphylaxis. Top, representative traces of ASIC1a outward currents. Extracellular ion concentrations were (mm): 130 NMDGCl, 10 NaCl, 1.8 CaCl2, 1.0 MgCl2, 10 Hepes, pH 7.4. For acidic activation solution (pH 5.0), Hepes was replaced by Mes. Holding potential was +20 mV during the test period. n = 9.
Figure 7
Figure 7
Calcium attenuates tachyphylaxis A, top, ASIC1a was repeatedly activated by pH 5 either with 0.1 mm extracellular Ca2+ (left) or with 10 mm extracellular Ca2+ (right). Bottom, current amplitudes were normalized to the first amplitude. Continuous lines represent fits to a single exponential function. Calcium attenuated tachyphylaxis: 0.1 Ca2+, n = 10; 1.8 Ca2+, n = 10; 10 Ca2+, n = 11. *P < 0.01, **P < 0.001 by ANOVA. B, top, ASIC1a was repeatedly activated by pH 5 either with 1.8 Ca2+–1.0 Mg2+ (left) or with 0 Ca2+–2.8 Mg2+ (right). Holding potential was 0 mV. Tachyphylaxis was enhanced when extracellular Ca2+ was replaced by Mg2+. n = 7 for 1.8 Ca2+–1.0 Mg2+ and n = 9 for 0 Ca2+–2.8 Mg2+. *P < 0.01, **P < 0.001 by t test. C, block of the ion pore by Ca2+ is not involved in tachyphylaxis. Top, ASIC1a mutant E425GD432C was repeatedly activated by pH 5 either with 1.8 mm (left) or with 10 mm extracellular Ca2+ (right). Extracellular concentration of Mg2+ was always 1 mm. Calcium attenuated tachyphylaxis as for ASIC1a wt: 1.8 Ca2+, n = 6; 10 Ca2+, n = 8. For direct comparison, the results for ASIC1a wt from Fig. 7A are shown as light symbols and the respective fits as dashed lines.
Figure 8
Figure 8
ASIC1a is H+ permeable A, ASIC1a was repeatedly activated by either 1 μm H+ (pH 6, top) or 100 μm H+ (pH 4, bottom). The concentrations of the other ions were fixed at (mm): 1 NaCl, 90 NMDGCl, 0 CaCl2, 3 MgCl2, 10 Mes, 10 Hepes. The holding potential was changed as indicated. Black bars indicate application of acid. As can be seen, the potential at which the current reversed its sign shifted by at least 10 mV when the H+ concentration was raised from 1 μm to 100 μm. Note that desensitization was faster at pH 4. B, ASIC1a was repeatedly activated by pH 5. The holding potential was 0 mV (n = 19), –70 mV (n = 17) or –120 mV (n = 13). Relative current amplitudes normalized to the first amplitude are shown. Continuous lines represent fits to a single exponential function. The solution contained (mm): 140 NaCl, 0 CaCl2, 3 MgCl2, 10 Hepes. For acidic activation solution, Hepes was replaced by Mes. **P < 0.001 by ANOVA.
Figure 9
Figure 9
Intracellular acidification enhances tachyphylaxis A, top, ASIC1a was repeatedly activated by pH 6; conditioning pH was pH 7.3. In the experimental group, during the 60 s intervals, 90 mm NaHCO3 was applied to acidify the intracellular compartment. Bottom, current amplitudes were normalized to the first amplitude. Continuous lines represent fits to a single exponential function. n = 13 for the control group, n = 11 for the experimental group. **P < 0.001 by t test. B, top, ASIC1a was repeatedly activated by pH 5. In the experimental group, 90 mm NaHCO3 was applied for 5 min. Bottom, relative current amplitudes, normalized to the first amplitude, are shown as bars. The first amplitude after HCO3 incubation (‘3rd application’) was not smaller than in the control group. n = 11 for the control group, n = 10 for the experimental group.
Figure 10
Figure 10
Tachyphylaxis is related to permeability for divalent cations Top, chimeric channels are schematically drawn. NH2 terminal sequences from ASIC1a are shown as open bars, those from ASIC1b as grey bars. The first transmembrane domain is indicated as a black box and the common C-terminus is shown as a black bar; only its first part is shown. The number denotes the number of exchanged amino acids; for example, in chimera C22 the NH2 terminal 22 amino acids of ASIC1a had been exchanged by the corresponding amino acids of ASIC1b. The chimeras did have a shorter NH2 terminus than ASIC1b; this shorter NH2 terminus corresponds to M3 in Bässler et al. (2001). Chimeras have already been reported in Bässler et al. (2001) and Babini et al. (2002). Middle, current amplitudes were normalized to the first amplitude. Continuous lines represent fits to a single exponential function. Activation was with pH 5. n = 6–14. Bottom, ratio of the sixth current amplitude to the first amplitude. The sixth amplitude was always significantly smaller than the first, except for ASIC1b. *P < 0.01, **P < 0.001 by paired t test.

Similar articles

Cited by

References

    1. Alvarez De La Rosa D, Zhang P, Shao D, White F, Canessa CM. Functional implications of the localization and activity of acid-sensitive channels in rat peripheral nervous system. Proc Natl Acad Sci U S A. 2002;99:2326–2331. - PMC - PubMed
    1. Askwith CC, Benson CJ, Welsh MJ, Snyder PM. DEG/ENaC ion channels involved in sensory transduction are modulated by cold temperature. Proc Natl Acad Sci U S A. 2001;98:6459–6463. - PMC - PubMed
    1. Askwith CC, Wemmie JA, Price MP, Rokhlina T, Welsh MJ. Acid-sensing ion channel 2 (ASIC2) modulates ASIC1 H+-activated currents in hippocampal neurons. J Biol Chem. 2004;279:18296–18305. - PubMed
    1. Babini E, Paukert M, Geisler HS, Gründer S. Alternative splicing and interaction with di- and polyvalent cations control the dynamic range of acid-sensing ion channel 1 (ASIC1) J Biol Chem. 2002;277:41597–41603. - PubMed
    1. Baron A, Waldmann R, Lazdunski M. ASIC-like, proton-activated currents in rat hippocampal neurons. J Physiol. 2002;539:485–494. - PMC - PubMed

Publication types

MeSH terms

LinkOut - more resources