. 2007 Mar 1;579(Pt 2):445-64.
doi: 10.1113/jphysiol.2002.019356. Epub 2007 Jan 4.

GABA excitation in mouse hilar neuropeptide Y neurons

Affiliations

GABA excitation in mouse hilar neuropeptide Y neurons

Li-Ying Fu et al. J Physiol. .

Abstract

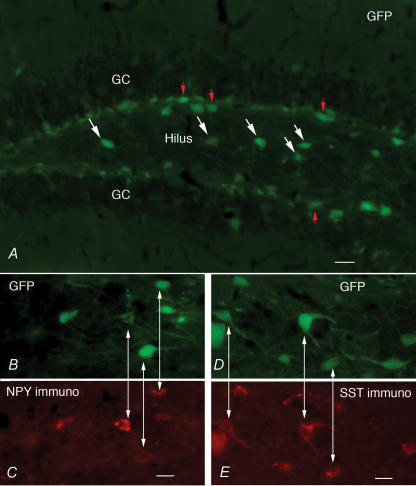
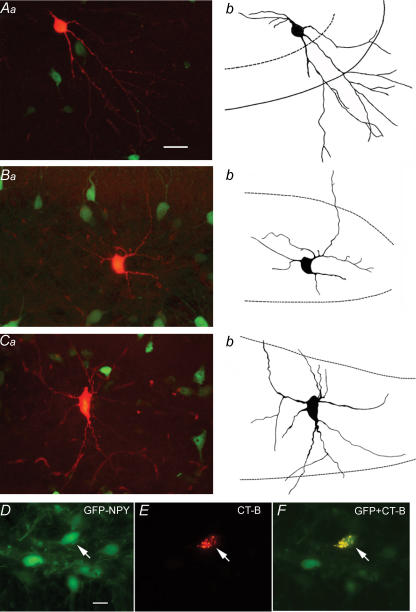
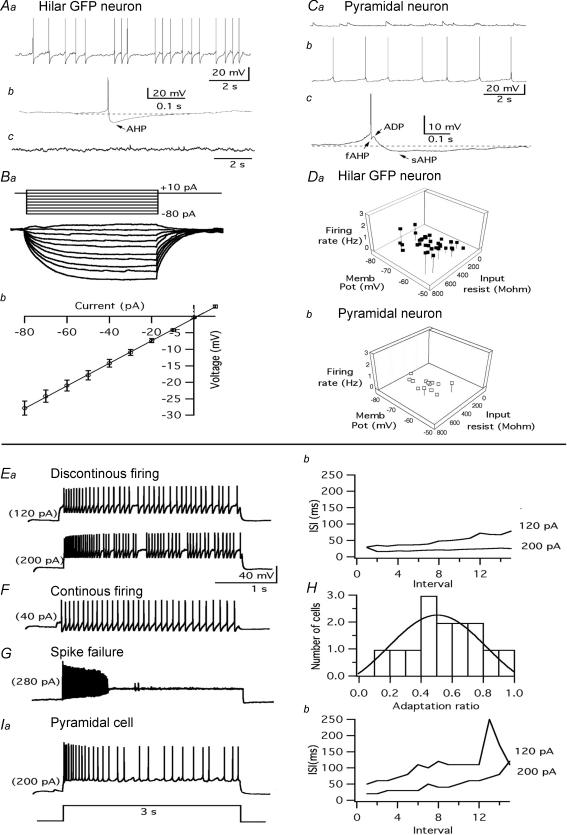
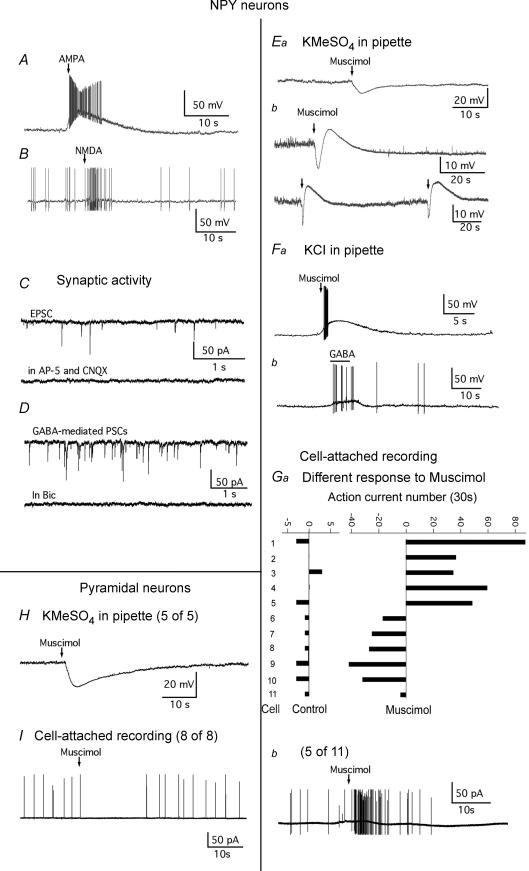
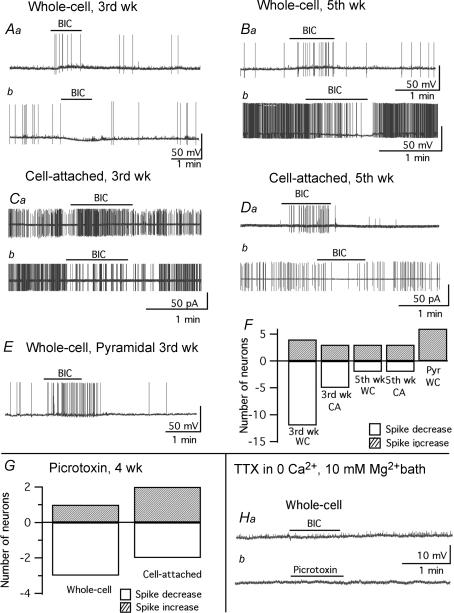
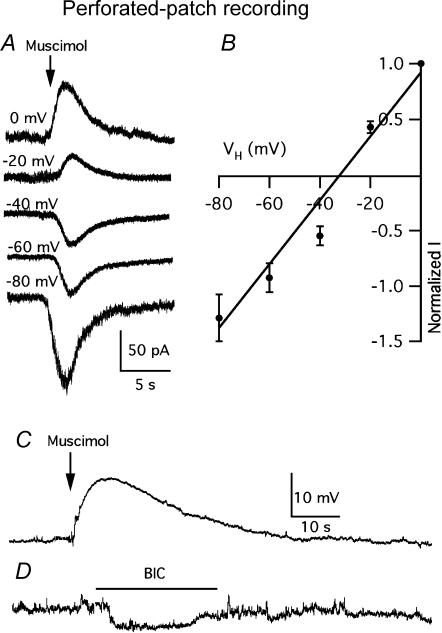
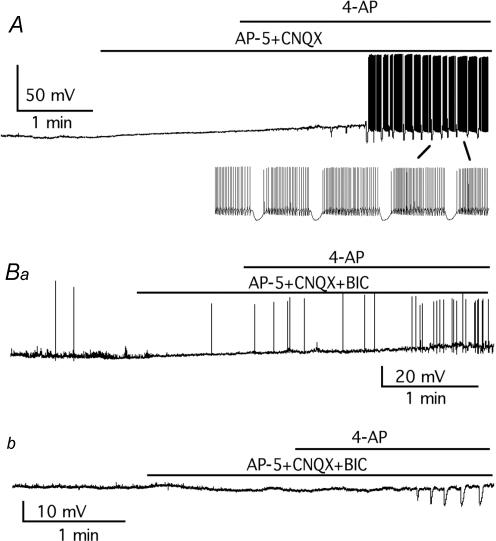
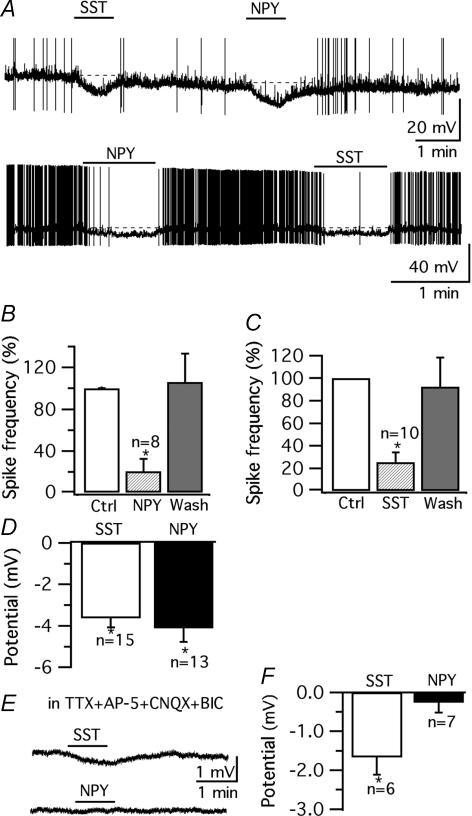
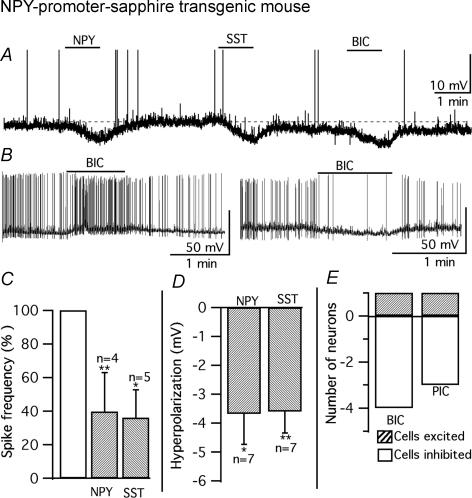
Neuropeptide Y-containing interneurons in the dentate hilar area play an important role in inhibiting the activity of hippocampal circuitry. Hilar cells are often among the first lost in hippocampal epilepsy. As many types of neurons are found in the hilus, we used a new transgenic mouse expressing green fluorescent protein (GFP) in a subset of neurons that colocalized neuropeptide Y (NPY), somatostatin (SST), and GABA for whole-cell, perforated, and cell-attached recording in 240 neurons. As these neurons have not previously been identifiable in live slices, they have not been the focus of physiological analysis. Hilar NPY neurons showed modest spike frequency adaptation, a large 15.6 +/- 1.0 mV afterhyperpolarization, a mean input resistance of 335 +/- 26 M Omega, and were capable of fast-firing. Muscimol-mediated excitatory actions were found in a nominally Ca(2+)-free/high-Mg(2+) bath solution using cell-attached recording. GABA(A) receptor antagonists inhibited half the recorded neurons and blocked burst firing. Gramicidin perforated-patch recording revealed a GABA reversal potential positive to both the resting membrane potential and spike threshold. Together, these data suggest GABA is excitatory to many NPY cells. NPY and SST consistently hyperpolarized and reduced spike frequency in these neurons. No hyperpolarization of NPY on membrane potential was detected in the presence of tetrodotoxin, AP5, CNQX and bicuculline, supporting an indirect effect. Under similar conditions, SST hyperpolarized the cells, suggesting a direct postsynaptic action. Depolarizing actions of GABA and GABA-dependent burst-firing may synchronize a rapid release of GABA, NPY, and SST, leading to pre- and postsynaptic inhibition of excitatory hippocampal circuits.


Figures

Figure 1
Figure 1. GFP expression in hilar NPY neurons
A, low-magnification photomicrograph showing neurons in the transgenic mouse that express GFP in the hilus (white arrows). Other neurons at the granule cell (GC) border also expressed GFP (red arrows), but were not studied here. B, at a higher magnification, hilar GFP-positive cells are shown, and the same cells are showin in C after immunostaining with antisera against NPY. All GFP-positive cells are immunoreactive for NPY. D, in another section, hilar cells expressing GFP are shown. E shows the same area after immunostaining for somatostatin. GFP-expressing cells are immunoreactive with somatostatin antisera. Scale bar, A: 25 μm; BE: 10 μm.
Figure 2
Figure 2. Dendritic arbors of typical hilar NPY neurons
Dendritic arbors were studied by filling green NPY hilar neurons with the red dye, Alexa Fluor hydrazide 594, through a patch pipette. As filled cells have both green (GFP) and red (Alexa dye), their final colour is orange. Aa, Ba and Ca show scanning confocal images of the left hilar NPY neurons filled with dye, Ab, Bb and Cb show the traces of the corresponding photograph of the dye-filled neurons. The dotted line represents the inner border of the dentate granule cells, and the continuous line represents the outer border of the dentate granule cell layer. A shows a NPY cell with dendrites that primarily run into the dentate granule cell layer and stratum moleculare. B shows a simpler cell, with less branching and dendrites confined primarily to the hilus. C shows a more complex dendritc tree than seen in B, with dendrites that are mostly restricted to the hilus. Scale bar, 30 μm. DF, in this series of three micrographs of the same field, GFP-expressing NPY cells are seen in D, a red cell that retrogradely transported cholera toxin B-subunit (CT-B) after dye injections into the septum is found in E, and F shows the GFP-labelled cell that also transported CT-B. Arrows point at the same cell. Scale bar, 15 μm.
Figure 3
Figure 3. Membrane properties of hilar NPY neurons
Aa, spontaneous spikes of a GFP-neuron in the hilar area recorded under current clamp at resting membrane potential (−58.0 mV). Ab, single action potential showing a large afterhyperpolarization (AHP) with an amplitude of 17.5 mV. Ac, a typical silent GFP-neuron in the hilar area at resting membrane potential of −71.8 mV. Ba, voltage traces evoked by a step current injection from −80 to +10 pA in hilar GFP- neurons. Bb, Mean current–voltage relationship of hilar NPY neurons (mean ±sem) (n= 28). Ca, a typical silent CA3 pyramidal neuron at resting membrane potential of −74 mV. Cb, spontaneous firing of a CA3 pyramidal cell at resting membrane potential (−64.2 mV). Cc, single action potential of CA3 pyramidal cell showing a triphasic AHP. The upper part of the action potential was cut to amplify the AHP. Da and b, three-dimensional graphs show the membrane properties including spontaneous spike frequency, input resistance, and membrane potential in hilar NPY neurons (Da) and CA3 pyramidal neurons (Db). Ea, response of a NPY neuron showing normal spike frequency adaptation to depolarizing current pulses of 120 and 200 pA. Eb, graph shows the interspike interval (ISI) during the train plotted against the number of the interval for the NPY neuron in Ea. F, an adapting NPY neuron shows continuous firing to a +40 pA current injection. G, spike failure was observed with +280 pA current injection. H, the histogram plots the adaptation ratios of 14 hilar NPY neurons. The histogram is fitted by a Gaussian function (dark, smooth line). Ia and b, firing traces (Ia) and plots of ISI versus number of the interval (Ib) of a CA3 pyramidal cell in response to depolarizing current pulses of +120 and +200 pA.
Figure 4
Figure 4. Responses of hilar NPY neurons to GABA and glutamate receptor agonists and antagonists
A and B, glutamate agonists AMPA (25 μm) and NMDA (50 μm) excited the hilar NPY neurons, respectively. C, representative traces showing that spontaneous EPSCs recorded with voltage clamp in the presence of BIC (30 μm) in the bath are blocked by glutamate receptor antagonists AP-5 (50 μm) and CNQX (10 μm). D, representative traces showing spontaneous GABA-mediated PSCs are blocked by BIC (30 μm) in the presence of AP-5 (50 μm) and CNQX (10 μm) in the bath solution. Ea and b, different responses to GABAA agonist muscimol (25 μm). Ea, muscimol hyperpolarizes the membrane potential. Eb, muscimol shows a biphasic effect on a hilar NPY neuron, i.e. a hyperpolarization followed by a depolarization, and this effect can be repeated twice in the same cell. Fa and b, excitation by muscimol (25 μm) and GABA (100 μm) on a typical cell recorded with KCl pipette solution. Ga, in the control period before muscimol application, the horizontal line shows the change in spike frequency over 30 s. When muscimol is added (right side), spike frequency changes dramatically, but some hilar NPY neurons show a large increase (extending to the right), others show a substantial decrease (extending to the left). The cell identity for the 11 cells is shown on the far left. These data show muscimol evokes two clear-cut different effects depending on the cell recorded. Gb, typical trace showing that muscimol (25 μm) excites the hilar NPY interneurons in 0 mm Ca2+/10 mm Mg2+ bath solution with cell-attached recording. H and I, typical traces showing the inhibitory effect of muscimol (25 μm) on CA3 pyramidal cells with whole-cell recording (H) and cell-attached recording (I).
Figure 5
Figure 5. Effects of GABAA receptor antagonists BIC (30 μm) and picrotoxin (PIC, 80 μm) on hilar NPY neurons at different ages under whole-cell and cell-attached recording
Aa and b, representative traces with whole-cell recording showing the excitatory (Aa) and inhibitory (Ab) effect of BIC on two different neurons from mice during the third postnatal week. Ba and b, whole-cell recordings showing the excitatory (Ba) and inhibitory (Bb) effect of BIC on neurons from adult mice. Ca and b, excitatory (Ca) and inhibitory (Cb) effect of BIC on neurons from the third week postnatal mice with cell-attached recording. Da and b, excitatory (Da) and inhibitory (Db) effect of BIC on neurons from adult mice with cell-attached recording. E, a typical trace showing that BIC excites the CA3 pyramidal cell under whole-cell recording. F, bar graph showing the number of the NPY neurons and CA3 pyramidal neuron (Pyr) excited (upward bars) or inhibited (downward bars) by BIC at different ages with whole-cell recording (WC with KMeSO4 pipette solution) or cell-attached recording (CA). G, bar graph showing the number of cells from 5th-week-old-mice excited (upward bars) or inhibited (downward bars) by PIC under whole-cell recording or cell-attached recording. Ha and b, typical traces showing that, in 0 Ca2+/10 mm Mg2+ bath solution with TTX 0.5 μm, with whole-cell recording, the membrane potential of hilar NPY neurons was not changed by either BIC (30 μm) (Ha) or picroroxin (80 μm) (Hb).
Figure 6
Figure 6. GABA-reversal potential positive to resting membrane potential – gramicidin recordings
A, examples of muscimol-elicited currents at different membrane potentials. B, the I–V relationship estimated from the peak current amplitudes from the five cells with a GABA reversal potential positive to the resting membrane potential shows a mean reversal of −35.0 ± 4.2 mV. Error bars are sem. Currents were normalized to the peak currents recorded at holding potential VH= 0 mV in each cell. C, muscimol (25 μm) evoked a depolarization at resting membrane potential in a typical NPY cell with gramicidin perforated-patch recording. D, application of BIC (30 μm) induced a hyperpolarization in the same cell as C with gramicidin perforated-patch recording.
Figure 7
Figure 7. Burst firing is blocked by bicuculline
A, a typical rhythmic bursting of hilar NPY neuron evoked by 4-AP (50 μm) in the presence of AP-5 and CNQX. Hyperpolarizing potentials occurred at a frequency of 0.17 Hz. Ba and b, typical traces showing that no burst firing was evoked by 4-AP in the presence of BIC (together with AP-5 and CNQX), but hyperpolarizing potentials still occurred in some cells (Bb).
Figure 8
Figure 8. Inhibition of neuropeptide Y (NPY) 1 μm and somatostatin (SST) 1 μm on hilar NPY neurons
A, representative traces showing the effect of NPY and SST on spontaneous spike frequency in typical hilar GFP-neurons. In the upper trace, part of the spikes was cut in order to see the effect on membrane potential more clearly. B and C, mean effect of NPY (B, *P < 0.01, n= 8) and SST (C, *P < 0.01, n= 10) on spike frequency in hilar GFP-neurons. Both are completely reversible. D, mean hyperpolarization of NPY (*P < 0.01, n= 13) and SST (*P < 0.01, n= 15) on hilar GFP-neurons. E, typical traces represent the effects of SST and NPY on membrane potential of hilar NPY neurons in the presence of TTX (0.5 μm), AP-5 (50 μm), CNQX (10 μm) and BIC (30 μm) in the bath solution. F, mean effect of SST (*P < 0.01, n= 6) and NPY (P > 0.05, n= 7) on the membrane potential of hilar NPY neurons in the condition as F. Error bars are sem.
Figure 9
Figure 9. Whole-cell recording on hilar NPY neurons in brain slices from 5th-6th-week old NPY transgenic mice
A, inhibitory effect of NPY (1 μm), SST (1 μm) and BIC (30 μm) in the same cell. The upper part of action potentials were cut. B, traces show excitatory (left) and inhibitory (right) effect of BIC on two different hilar NPY neurons, respectively. C, mean effect of 1 μm NPY and SST on spike frequency. *P < 0.05, **P < 0.01, ANOVA. D, mean hyperpolarization of 1 μm NPY and SST on membrane potential. *P < 0.05, **P < 0.01, ANOVA. E, bar graph showing the number of cells excited (upward bars) or inhibited (downward bars) by BIC and PIC. Error bars are sem.

Similar articles

Cited by

References

    1. Acsády L, Kamondi A, Sik A, Freund T, Buzsaki G. GABAergic cells are the major postsynaptic targets of mossy fibers in the rat hippocampus. J Neurosci. 1998;18:3386–3403. - PMC - PubMed
    1. Acuna-Goycolea C, Tamamaki N, Yanagawa Y, Obata K, van den Pol AN. Mechanisms of neuropeptide Y, peptide YY, and pancreatic polypeptide inhibition of identified green fluorescent protein-expressing GABA neurons in the hypothalamic neuroendocrine arcuate nucleus. J Neurosci. 2005;25:7406–7419. - PMC - PubMed
    1. Akaike N. Gramicidin perforated patch recording and intracellular chloride activity in excitable cells. Prog Biophys Mol Biol. 1996;65:251–264. Review. - PubMed
    1. Alger B, Nicoll R. Pharmacological evidence for two kinds of GABA receptor on rat hippocampal pyramidal cells studied in vitro. J Physiol. 1982;328:125–141. - PMC - PubMed
    1. Amaral DG. A Golgi study of cell types in the hilar region of the hippocampus in the rat. J Comp Neurol. 1978;182:851–914. - PubMed

Publication types

MeSH terms